United States House of Representatives elections, 1902
| | |||||||||||||||||||||||||||||||||||
| |||||||||||||||||||||||||||||||||||
| |||||||||||||||||||||||||||||||||||
| |||||||||||||||||||||||||||||||||||
Elections to the United States House of Representatives held in 1902 occurred in the middle of President Theodore Roosevelt's first term, about a year after the assassination of President William McKinley in September 1901.
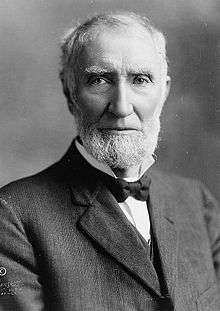
Due to the increased size of the House and the reapportionment that resulted from the 1900 U.S. Census, both the Republican Party and the Democratic Party gained seats simultaneously, which has not occurred in any future elections to date. The Democrats increased their share of the House, but not by enough to regain control. With a stable economy and no cornerstone issue, Democratic gains can mostly be linked to the effects of redistricting. Many of the new seats were in areas that featured a high number of immigrants, either Eastern and Southern European industrial workers or Northern European farmers. New immigrant groups trended Democratic. The Populist Party disappeared from the House, with its supporters almost unanimously switching to the Democratic Party. Notable freshmen included future Vice President and Speaker John Nance Garner (D-Texas).
This election marked the third and most recent time in American history where the incumbent President's party gained House seats in a midterm election while still losing seats in the Senate, the first two being in 1814 and 1822.
Election summaries
29 new seats were added in reapportionment following the 1900 Census.[3] No states lost seats, 16 had no change in apportionment, 14 gained 1 seat, 3 gained 2 seats, and 3 gained 3 seats. Two of the states that gained representation elected the new seat at-large.
| 207 | 3 | 176 |
| Republican | IR | Democratic |
| State | Type | Total seats | Republican | Democratic | |||
|---|---|---|---|---|---|---|---|
| Seats | Change | Seats | Change | Seats | Change | ||
| Alabama | District | 9 | |
0 | |
9 | |
| Arkansas | District | 7 | |
0 | |
7 | |
| California | District | 8 | |
5 | |
3 | |
| Colorado | District +at-large[Note 4] |
3[Note 5] | |
3 | |
0 | |
| Connecticut | District +at-large[Note 4] |
5 | |
5 | |
0 | |
| Delaware | At-large | 1 | |
0 | |
1 | |
| Florida | District | 3 | |
0 | |
3 | |
| Georgia | District | 11 | |
0 | |
11 | |
| Idaho | At-large | 1[Note 5] | |
1 | |
0 | |
| Illinois | District | 25 | |
17 | |
8 | |
| Indiana | District | 13 | |
9 | |
4 | |
| Iowa | District | 11 | |
10 | |
1 | |
| Kansas | District +at-large |
8 | |
8 | |
0 | |
| Kentucky | District | 11 | |
1 | |
10 | |
| Louisiana | District | 7 | |
0 | |
7 | |
| Maine[Note 7] | District | 4 | |
4 | |
0 | |
| Maryland | District | 6 | |
4 | |
2 | |
| Massachusetts | District | 14 | |
10 | |
4 | |
| Michigan | District | 12 | |
11 | |
1 | |
| Minnesota | District | 9 | |
8 | |
1 | |
| Mississippi | District | 8 | |
0 | |
8 | |
| Missouri | District | 16 | |
1 | |
15 | |
| Montana | At-large | 1[Note 5] | |
1 | |
0 | |
| Nebraska | District | 6[Note 8] | |
5 | |
1 | |
| Nevada | At-large | 1 | |
0 | |
1 | |
| New Hampshire | District | 2 | |
2 | |
0 | |
| New Jersey | District | 10 | |
7 | |
3 | |
| New York | District | 37 | |
20 | |
17 | |
| North Carolina | District | 10 | |
0 | |
10 | |
| North Dakota | District[Note 9] | 2 | |
2 | |
0 | |
| Ohio | District | 21 | |
17 | |
4 | |
| Oregon[Note 7] | District | 2 | |
2 | |
0 | |
| Pennsylvania | District[Note 10] | 32 | |
29[Note 3] | |
3 | |
| Rhode Island | District | 2 | |
1 | |
1 | |
| South Carolina | District | 7 | |
0 | |
7 | |
| South Dakota | At-large | 2 | |
2 | |
0 | |
| Tennessee | District | 10 | |
2 | |
8 | |
| Texas | District | 16 | |
0 | |
16 | |
| Utah | At-large | 1 | |
1 | |
0 | |
| Vermont[Note 7] | District | 2 | |
2 | |
0 | |
| Virginia | District | 10 | |
1 | |
9 | |
| Washington | At-large | 3 | |
3 | |
0 | |
| West Virginia | District | 5 | |
5 | |
0 | |
| Wisconsin | District | 11 | |
10 | |
1 | |
| Wyoming | At-large | 1 | |
1 | |
0 | |
| Total | 386 | |
210[Note 3] 54.4% |
|
176 45.6% |
| |
The previous election had 5 Populists, but the party completely disappeared from the U.S. House in the 1902 elections.
[[Image:58 us house membership.png|thumb|350px|
]] |
[[Image:58 us house changes.png|thumb|350px|
]] | ||||||||||||||||||
Early election dates
In 1902, three states, with 8 seats among them, held elections early:
Complete returns
Party abbreviations:
- D: Democratic
- Pr: Prohibition
- R: Republican
- S: Socialist
California
| District | Incumbent | Party | First elected |
Result | Candidates |
|---|---|---|---|---|---|
| California 1 | Samuel D. Woods Redistricted from the 2nd district |
Republican | 1900 | Retired Republican hold |
James N. Gillett (R) 50.5% Thomas S. Ford (D) 46.7% M. E. Shore (S) 1.9% W. O. Clark (Pr) 0.9% |
| California 2 | Frank Coombs Redistricted from the 1st district |
Republican | 1900 | Lost re-election Democratic gain |
Theodore A. Bell (D) 49.2% Frank Coombs (R) 48.3% G. H. Rogers (S) 1.7% W. P. Fassett (Pr) 0.8% |
| California 3 | Victor H. Metcalf | Republican | 1898 | Re-elected | Victor H. Metcalf (R) 66.2% Calvin B. White (D) 27.7% M. W. Wilkins (S) 5% T. H. Montgomery (Pr) 1.1% |
| California 4 | Julius Kahn | Republican | 1898 | Lost re-election Democratic gain |
Edward J. Livernash (D) 49.2% Julius Kahn (R) 48.7% William Costley (S) 1.9% Joseph Rowell (Pr) 0.2% |
| California 5 | Eugene F. Loud | Republican | 1890 | Lost re-election Democratic gain |
William J. Wynn (D) 56.5% Eugene F. Loud (R) 41.2% Joseph Lawrence (S) 1.5% Frank W. Caton (Pr) 0.7% |
| California 6 | James C. Needham Redistricted from the 7th district |
Republican | 1898 | Re-elected | James C. Needham (R) 53.5% Gaston N. Ashe (D) 42.5% J. L. Cobb (S) 2.5% L. C. Jolley (Pr) 1.4% |
| California 7 | James McLachlan Redistricted from the 6th district |
Republican | 1900 | Re-elected | James McLachlan (R) 64.8% Carl A. Johnson (D) 27% George H. Hewes (S) 4.2% Frederick F. Wheeler (Pr) 4% |
| California 8 | None (District created) | New district Republican gain |
Milton J. Daniels (R) 51.9% William E. Smythe (D) 40.8% Noble A. Richardson (S) 5.4% Ellsworth Leonardson (Pr) 2% | ||
Florida
| District | Incumbent | Party | First elected |
Result | Candidates |
|---|---|---|---|---|---|
| Florida 1 | Stephen M. Sparkman | Democratic | 1894 | Re-elected | Stephen M. Sparkman (D) 100% |
| Florida 2 | Robert Wyche Davis | Democratic | 1896 | Re-elected | Robert Wyche Davis (D) 100% |
| Florida 3 | None (District created) | Democratic win | William B. Lamar (D) 100% | ||
South Carolina
| District | Incumbent | Party | First elected |
Result | Candidates |
|---|---|---|---|---|---|
| South Carolina 1 | William Elliott | Democratic | 1886 1896 |
Retired to run for the Senate Democratic hold |
George Swinton Legaré (D) 95.5% Aaron P. Prioleau (R) 4.5% |
| South Carolina 2 | W. Jasper Talbert | Democratic | 1892 | Retired to run for Governor Democratic hold |
George W. Croft (D) 94.9% W. S. Dixon (R) 5.0% Others 0.1% |
| South Carolina 3 | Asbury Latimer | Democratic | 1892 | Retired to run for the Senate Democratic hold |
Wyatt Aiken (D) 98.9% John Scott (R) 1.1% |
| South Carolina 4 | Joseph T. Johnson | Democratic | 1900 | Re-elected | Joseph T. Johnson (D) 98.7% L. W. C. Blalock (R) 1.3% |
| South Carolina 5 | David E. Finley | Democratic | 1898 | Re-elected | David E. Finley (D) 99.3% C. P. T. White (R) 0.7% |
| South Carolina 6 | Robert B. Scarborough | Democratic | 1900 | Re-elected | Robert B. Scarborough (D) 100% |
| South Carolina 7 | Asbury F. Lever | Democratic | 1901 (special) | Re-elected | Asbury F. Lever (D) 96.2% Alexander D. Dantzler (R) 3.8% |
See also
Notes
- ↑ Three states held early elections between June 2 and September 18.
- ↑ Included 1 member of the Silver Republican faction, John F. Shafroth, of CO-01.
- 1 2 3 Includes 3 Independent Republicans elected to PA-29, PA-31, and PA-32 in the Pittsburgh area.
- 1 2 Additional seat elected at-large due to State delaying redistricting.
- 1 2 3 Election of 1900 saw the election of 1 Populist.
- ↑ There was one member of the Silver Republican Party faction elected in 1900, John F. Shafroth. Shafroth attempted to get elected as a Democrat in 1902, but his election was contested and overturned.
- 1 2 3 Elections held early.
- ↑ Election of 1900 saw the election of 2 Populists in Nebraska.
- ↑ Changed from at-large.
- ↑ At-large seats eliminated in redistricting.
References
- 1 2 "Party Divisions of the House of Representatives* 1789–Present". Office of the Historian, United States House of Representatives. Retrieved May 18, 2015.
- 1 2 Martis, pp. 156–157.
- ↑ Apportionment Act of 1901
Bibliography
- Republican Congressional Committee, The Republican Campaign Textbook 1902 (1902).
- Dubin, Michael J. (March 1, 1998). United States Congressional Elections, 1788-1997: The Official Results of the Elections of the 1st Through 105th Congresses. McFarland and Company. ISBN 978-0786402830.
- Martis, Kenneth C. (January 1, 1989). The Historical Atlas of Political Parties in the United States Congress, 1789-1989. Macmillan Publishing Company. ISBN 978-0029201701.
- Moore, John L., ed. (1994). Congressional Quarterly's Guide to U.S. Elections (Third ed.). Congressional Quarterly Inc. ISBN 978-0871879967.
- "Party Divisions of the House of Representatives* 1789–Present". Office of the Historian, House of United States House of Representatives. Retrieved January 21, 2015.
External links
- Office of the Historian (Office of Art & Archives, Office of the Clerk, U.S. House of Representatives)

