United States presidential election in Tennessee, 2004
| | ||||||||||||||||||||||||||||||||
| ||||||||||||||||||||||||||||||||
| ||||||||||||||||||||||||||||||||
|
| ||||||||||||||||||||||||||||||||
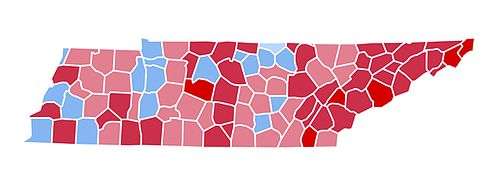
| County Results
Kerry—60-70%
Kerry—50-60%
Kerry—<50%
Bush—50-60%
Bush—60-70%
Bush—70-80% | ||||||||||||||||||||||||||||||||
| ||||||||||||||||||||||||||||||||
The 2004 United States presidential election in Tennessee took place on November 2, 2004 throughout all 50 states and D.C., which was part of the 2004 United States presidential election. Voters chose 11 representatives, or electors to the Electoral College, who voted for President and Vice President.
Tennessee was won by incumbent President George W. Bush by a 14.3% margin of victory. Prior to the election, all 12 news organizations considered this a state Bush would win, or otherwise considered as a safe red state. In the past 14 presidential elections, the Republican nominee won 10 of them. The state trended more Republican by 10.4 points from Bush's performance in 2000. Bush won most of the counties and congressional districts in the state. Third party and independent candidates made up just 0.7% of the vote.
Primaries
The 2004 Tennessee primary took place on February 10, 2004 as part of the 2004 United States Democratic presidential primaries. The delegate allocation is Proportional. the candidates are awarded delegates in proportion to the percentage of votes received and is open to anyone. A total of 69 (of 85) delegates are awarded proportionally. A 15 percent threshold is required to receive delegates. Frontrunner John Kerry won the primary with Senator John Edwards and former general Wesley Clark both obtaining over 20% and receiving delegates.
Kerry won most of the counties and all the congressional districts. Although, Kerry didn't do well in the middle of the state, winning the 4th, 5th, and 6th CDs with less than 40% of the vote. Edwards won 4 counties in the state. In Sullivan County, Tennessee Edwards obtained 42% of the vote but lost to Kerry with a small margin. Clark gained over 30% of the vote in just 2 counties, including his best performance in Montgomery County, TN. The largest turnout came from Shelby County and Davidson county.
| United States presidential primary election in Tennessee, 2004[1][2] | ||||||
|---|---|---|---|---|---|---|
| Party | Candidate | Votes | Percentage | Delegates | ||
| Democratic | John Kerry | 151,527 | 41.0% | 31 | ||
| Democratic | John Edwards | 97,914 | 26.5% | 20 | ||
| Democratic | Wesley Clark | 85,315 | 23.1% | 18 | ||
| Democratic | Howard Dean | 16,128 | 4.4% | 0 | ||
| Democratic | Al Sharpton | 6,107 | 1.7% | 0 | ||
| Democratic | Joe Lieberman | 3,213 | 0.9% | 0 | ||
| Democratic | Uncommitted | 2,727 | 0.7% | 0 | ||
| Democratic | Carol Moseley-Braun | 2,490 | 0.7% | 0 | ||
| Democratic | Dennis Kucinich | 2,279 | 0.6% | 0 | ||
| Democratic | Richard Gephardt | 1,402 | 0.4% | 0 | ||
| Democratic | Lyndon Larouche | 283 | 0.1% | 0 | ||
| Totals | - | 100.00% | 69 | |||
| Voter turnout | % | — | ||||
Campaign
Predictions
| Elections in Tennessee |
|---|
 |
There were 12 news organizations who made state by state predictions of the election. Here are their last predictions before election day.[3]
- D.C. Political Report: Slight Republican
- Associated Press: Leans Bush
- CNN: Bush
- Cook Political Report: Lean Republican
- Newsweek: Solid Bush
- New York Times: Solid Bush
- Rasmussen Reports: Bush
- Research 2000: Solid Bush
- Washington Post: Bush
- Washington Times: Solid Bush
- Zogby International: Bush
- Washington Dispatch: Bush
Polling
Bush won every single pre-election poll, and won each with at least 49%. The final 3 polls averaged Bush leading 56% to 40%.[4]
Fundraising
Bush raised $4,636,916.[5] Kerry raised $1,187,742.[6]
Advertising and visits
Neither campaign advertised or visited this state during the fall election.[7][8]
Analysis
While the Republicans control slightly more than half of the state, Democrats have strong support in the cities of Memphis and Nashville and in parts of Middle Tennessee and in West Tennessee north and east of Memphis[9] The latter area includes a large rural African-American population.[10]
In the 2000 presidential election, Vice President Al Gore, a former U.S. Senator from Tennessee, couldn't carry his home state. The majority of voters support for Republican George W. Bush increased in 2004, with his margin of victory in the state increasing from 4% in 2000 to 14% in 2004.[11] Southern Democratic nominees (e.g., Lyndon B. Johnson, Jimmy Carter, Bill Clinton) usually fare better in Tennessee, especially among split-ticket voters outside the metropolitan areas.
Results
| United States presidential election in Tennessee, 2004 | ||||||
|---|---|---|---|---|---|---|
| Party | Candidate | Running mate | Votes | Percentage | Electoral votes | |
| Republican | George W. Bush | Dick Cheney | 1,384,375 | 56.8% | 11 | |
| Democratic | John Kerry | John Edwards | 1,036,477 | 42.5% | 0 | |
| Independent | Ralph Nader | Peter Camejo | 8,992 | 0.4% | 0 | |
| Libertarian | Michael Badnarik | Richard Campagna | 4,866 | 0.2% | 0 | |
| Constitution Party | Michael Peroutka | Chuck Baldwin | 2,570 | 0.1% | 0 | |
| Green Party | David Cobb | Pat LaMarche | 33 | 0.0% | 0 | |
| Socialist | Walt Brown | Mary Alice Herbert | 6 | 0.0% | 0 | |
| Totals | - | 100.00% | 11 | |||
| Voter turnout (Voting age population) | 54.8% | |||||
By county
| County | Kerry% | Kerry# | Bush% | Bush# | Others% | Others# |
|---|---|---|---|---|---|---|
| Anderson | 40.7% | 12,896 | 58.4% | 18,510 | 0.9% | 276 |
| Bedford | 38.4% | 5,268 | 60.9% | 8,351 | 0.6% | 87 |
| Benton | 54.6% | 3,869 | 44.6% | 3,161 | 0.8% | 60 |
| Bledsoe | 40.1% | 1,927 | 59.2% | 2,849 | 0.7% | 33 |
| Blount | 30.9% | 15,047 | 68.2% | 33,241 | 0.9% | 424 |
| Bradley | 26.5% | 9,431 | 72.8% | 25,951 | 0.7% | 255 |
| Campbell | 43.7% | 6,163 | 55.7% | 7,859 | 0.7% | 96 |
| Cannon | 45.9% | 2,515 | 53.5% | 2,931 | 0.6% | 35 |
| Carroll | 43.1% | 5,070 | 56.2% | 6,605 | 0.7% | 82 |
| Carter | 28.7% | 6,395 | 70.7% | 15,768 | 0.7% | 150 |
| Cheatham | 37.7% | 5,918 | 61.6% | 9,676 | 0.7% | 103 |
| Chester | 35.3% | 2,242 | 64.3% | 4,086 | 0.5% | 29 |
| Claiborne | 38.3% | 4,034 | 61.2% | 6,448 | 0.6% | 58 |
| Clay | 49.9% | 1,675 | 49.2% | 1,650 | 1.0% | 32 |
| Cocke | 32.0% | 3,935 | 67.4% | 8,297 | 0.6% | 79 |
| Coffee | 40.9% | 8,243 | 58.5% | 11,793 | 0.6% | 131 |
| Crockett | 43.0% | 2,459 | 56.7% | 3,242 | 0.4% | 21 |
| Cumberland | 35.2% | 8,327 | 64.1% | 15,144 | 0.7% | 166 |
| Davidson | 54.8% | 132,737 | 44.5% | 107,839 | 0.7% | 1,726 |
| Decatur | 46.5% | 2,268 | 52.6% | 2,566 | 0.9% | 45 |
| DeKalb | 48.0% | 3,445 | 51.4% | 3,685 | 0.6% | 43 |
| Dickson | 44.5% | 8,597 | 54.8% | 10,567 | 0.7% | 134 |
| Dyer | 38.3% | 5,287 | 61.2% | 8,447 | 0.5% | 75 |
| Fayette | 38.7% | 5,696 | 60.8% | 8,962 | 0.5% | 79 |
| Fentress | 35.4% | 2,371 | 64.1% | 4,293 | 0.5% | 36 |
| Franklin | 45.7% | 7,800 | 53.5% | 9,129 | 0.9% | 148 |
| Gibson | 44.3% | 8,511 | 55.1% | 10,596 | 0.6% | 114 |
| Giles | 45.7% | 5,273 | 53.4% | 6,163 | 0.9% | 101 |
| Grainger | 34.1% | 2,569 | 65.2% | 4,907 | 0.7% | 51 |
| Greene | 31.6% | 7,635 | 67.7% | 16,382 | 0.7% | 177 |
| Grundy | 56.6% | 2,789 | 42.7% | 2,107 | 0.7% | 33 |
| Hamblen | 33.3% | 7,433 | 66.1% | 14,742 | 0.6% | 143 |
| Hamilton | 41.8% | 57,302 | 57.4% | 78,547 | 0.8% | 1,087 |
| Hancock | 30.5% | 777 | 68.8% | 1,756 | 0.7% | 18 |
| Hardeman | 54.3% | 5,685 | 44.9% | 4,704 | 0.7% | 77 |
| Hardin | 38.5% | 3,834 | 61.2% | 6,087 | 0.3% | 33 |
| Hawkins | 33.0% | 6,684 | 66.5% | 13,447 | 0.5% | 102 |
| Haywood | 57.8% | 4,359 | 41.6% | 3,140 | 0.6% | 49 |
| Henderson | 34.2% | 3,448 | 65.2% | 6,585 | 0.6% | 63 |
| Henry | 43.5% | 5,732 | 55.7% | 7,340 | 0.8% | 105 |
| Hickman | 49.2% | 4,263 | 50.3% | 4,359 | 0.6% | 51 |
| Houston | 59.1% | 2,126 | 40.0% | 1,440 | 0.9% | 32 |
| Humphreys | 57.6% | 4,485 | 41.8% | 3,261 | 0.6% | 47 |
| Jackson | 59.3% | 2,998 | 40.1% | 2,026 | 0.6% | 32 |
| Jefferson | 31.8% | 5,469 | 67.5% | 11,625 | 0.7% | 121 |
| Johnson | 28.0% | 1,812 | 71.5% | 4,634 | 0.5% | 34 |
| Knox | 37.0% | 66,013 | 62.1% | 110,803 | 0.9% | 1,603 |
| Lake | 55.6% | 2,634 | 43.8% | 2,078 | 0.6% | 28 |
| Lauderdale | 51.5% | 4,474 | 48.0% | 4,164 | 0.5% | 44 |
| Lawrence | 39.6% | 6,592 | 59.8% | 9,959 | 0.6% | 107 |
| Lewis | 43.4% | 2,192 | 55.8% | 2,819 | 0.9% | 43 |
| Lincoln | 36.5% | 4,546 | 62.8% | 7,829 | 0.7% | 82 |
| Loudon | 28.7% | 5,708 | 70.7% | 14,041 | 0.6% | 115 |
| McMinn | 32.7% | 5,891 | 66.5% | 11,980 | 0.7% | 132 |
| McNairy | 41.3% | 4,101 | 58.3% | 5,787 | 0.4% | 36 |
| Macon | 36.8% | 2,738 | 62.8% | 4,670 | 0.3% | 25 |
| Madison | 43.5% | 16,840 | 56.1% | 21,679 | 0.4% | 156 |
| Marion | 48.3% | 5,548 | 51.0% | 5,862 | 0.7% | 82 |
| Marshall | 44.5% | 4,722 | 54.9% | 5,825 | 0.6% | 68 |
| Maury | 41.2% | 12,379 | 58.3% | 17,505 | 0.5% | 159 |
| Meigs | 38.6% | 1,595 | 60.5% | 2,500 | 0.9% | 37 |
| Monroe | 34.4% | 5,354 | 65.0% | 10,123 | 0.6% | 91 |
| Montgomery | 41.0% | 20,070 | 58.4% | 28,627 | 0.6% | 301 |
| Moore | 39.1% | 1,084 | 60.1% | 1,668 | 0.8% | 22 |
| Morgan | 39.7% | 2,924 | 59.8% | 4,401 | 0.5% | 35 |
| Obion | 41.0% | 5,549 | 58.1% | 7,859 | 0.9% | 127 |
| Overton | 53.1% | 4,518 | 46.3% | 3,941 | 0.6% | 51 |
| Perry | 50.1% | 1,579 | 48.3% | 1,522 | 1.6% | 49 |
| Pickett | 39.1% | 1,033 | 60.5% | 1,600 | 0.5% | 12 |
| Polk | 40.7% | 2,724 | 58.6% | 3,924 | 0.8% | 52 |
| Putnam | 40.0% | 10,566 | 59.1% | 15,637 | 0.9% | 239 |
| Rhea | 33.2% | 3,665 | 66.0% | 7,301 | 0.8% | 88 |
| Roane | 37.3% | 8,706 | 62.0% | 14,467 | 0.7% | 165 |
| Robertson | 39.0% | 9,865 | 60.5% | 15,331 | 0.5% | 127 |
| Rutherford | 37.5% | 31,647 | 61.8% | 52,200 | 0.7% | 562 |
| Scott | 40.5% | 3,086 | 59.1% | 4,509 | 0.4% | 33 |
| Sequatchie | 39.9% | 1,986 | 59.2% | 2,951 | 0.9% | 46 |
| Sevier | 27.8% | 8,621 | 71.5% | 22,143 | 0.7% | 206 |
| Shelby | 57.5% | 216,945 | 41.9% | 158,137 | 0.6% | 2,200 |
| Smith | 51.7% | 4,044 | 47.8% | 3,739 | 0.6% | 45 |
| Stewart | 51.2% | 2,860 | 47.9% | 2,675 | 0.9% | 48 |
| Sullivan | 31.3% | 19,637 | 67.9% | 42,555 | 0.7% | 447 |
| Sumner | 34.6% | 21,458 | 64.8% | 40,181 | 0.5% | 329 |
| Tipton | 34.0% | 7,379 | 65.4% | 14,178 | 0.6% | 120 |
| Trousdale | 58.0% | 1,851 | 41.2% | 1,314 | 0.58% | 26 |
| Unicoi | 31.8% | 2,374 | 67.4% | 5,030 | 0.8% | 59 |
| Union | 37.6% | 2,524 | 61.8% | 4,145 | 0.6% | 41 |
| Van Buren | 51.5% | 1,209 | 47.7% | 1,120 | 0.8% | 18 |
| Warren | 47.3% | 6,808 | 52.1% | 7,503 | 0.6% | 89 |
| Washington | 33.2% | 14,944 | 66.1% | 29,735 | 0.7% | 327 |
| Wayne | 32.6% | 1,951 | 66.8% | 3,999 | 0.6% | 34 |
| Weakley | 41.4% | 5,588 | 57.9% | 7,817 | 0.7% | 91 |
| White | 43.7% | 4,147 | 55.5% | 5,269 | 0.8% | 79 |
| Williamson | 27.3% | 21,732 | 72.1% | 57,451 | 0.6% | 467 |
| Wilson | 34.4% | 15,277 | 65.1% | 28,924 | 0.6% | 251 |
By congressional district
Bush won 7 of 9 congressional districts.[12]
| District | Bush | Kerry | Representative |
|---|---|---|---|
| 1st | 68% | 31% | William L Jenkins |
| 2nd | 64% | 35% | John J. Duncan, Jr. |
| 3rd | 61% | 38% | Zach Wamp |
| 4th | 58% | 41% | Lincoln Davis |
| 5th | 48% | 52% | Jim Cooper |
| 6th | 60% | 40% | Bart Gordon |
| 7th | 66% | 33% | Marsha Blackburn |
| 8th | 53% | 47% | John S. Tanner |
| 9th | 30% | 70% | Harold Ford Jr. |
Electors
Technically the voters of Tennessee cast their ballots for electors: representatives to the Electoral College. Tennessee is allocated 11 electors because it has 9 congressional districts and 2 senators. All candidates who appear on the ballot or qualify to receive write-in votes must submit a list of 11 electors, who pledge to vote for their candidate and his or her running mate. Whoever wins the majority of votes in the state is awarded all 11 electoral votes. Their chosen electors then vote for President and Vice President. Although electors are pledged to their candidate and running mate, they are not obligated to vote for them. An elector who votes for someone other than his or her candidate is known as a faithless elector.
The electors of each state and the District of Columbia met on December 13, 2004 to cast their votes for President and Vice President. The Electoral College itself never meets as one body. Instead the electors from each state and the District of Columbia met in their respective capitols.
The following were the members of the Electoral College from the state. All 9 were pledged to Bush/Cheney:[13]
- Susan Anderson
- Betty Cannon
- Winfield Dunn
- Geneva Williams Harrison
- Brock Hill
- Bruce Montgomery
- Claude Ramsey
- Bob Rial
- John Ryder
- Mark Tipps
- Sally Wall
References
- ↑ http://uselectionatlas.org/RESULTS/
- ↑ http://www.cnn.com/ELECTION/2004/primaries/pages/dates/02/03/
- ↑ http://www.dcpoliticalreport.com/members/2004/Pred2.htm#NW[]
- ↑ http://uselectionatlas.org/USPRESIDENT/GENERAL/CAMPAIGN/2004/polls.php?fips=47
- ↑ http://www.campaignmoney.com/political/campaigns/george_w_bush.asp?cycle=04
- ↑ http://www.campaignmoney.com/political/campaigns/john_f_kerry.asp?cycle=04
- ↑ http://www.cnn.com/ELECTION/2004/special/president/campaign.ads/
- ↑ http://www.cnn.com/ELECTION/2004/special/president/tracking/10.25.html
- ↑ Map - Tennessee 2000 Election Mapper
- ↑ Tennessee by County - GCT-PL. Race and Hispanic or Latino 2000 U.S. Census Bureau
- ↑ Tennessee: McCain Leads Both Democrats by Double Digits Rasumussen Reports, April 6, 2008
- ↑ http://www.swingstateproject.com/diary/4161/
- ↑ http://www.archives.gov/federal-register/electoral-college/2004_certificates/


