Three-dimensional graph
A three-dimensional graph is the graph of a function f(x, y) of two variables, or the graph of a relationship g(x, y, z) among three variables.
Provided that x, y, and z or f(x, y) are real numbers, the graph can be represented as a planar or curved surface in a three-dimensional Cartesian coordinate system. A three-dimensional graph is typically drawn on a two-dimensional page or screen using perspective methods, so that one of the dimensions appears to be coming out of the page.
Examples
The graph of the trigonometric function on the real line
is
- .
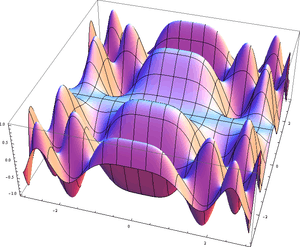
If this set is plotted on a three dimensional Cartesian coordinate system, the result is a surface (see above figure).

A three-dimensional graph of a sphere, with equation is shown at left.
Collapsing the information in a three-dimensional graph into a two-dimensional graph

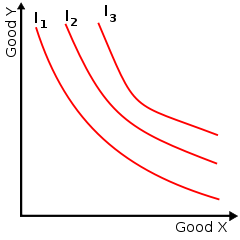
The information in a three-dimensional graph is often collapsed into a two-dimensional graph with the use of contour lines, as illustrated at right. The x and y axes are retained, but instead of depicting a z or f(x, y) axis as "coming out of the page (or screen)", all x, y combinations giving rise to the same z or f(x, y) value are connected with a contour line; an arbitrary number of these may be shown for various values of z or f(x, y).
See also
- Graph (disambiguation)
- Analytic geometry
- Cartesian coordinate system
- Euclidean space
- Coordinate system
- Dimension
- List of surfaces
- List of polygons, polyhedra and polytopes
- List of regular polytopes
| Wikimedia Commons has media related to Three-dimensional graph. |
