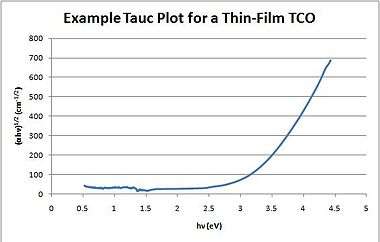
Tauc plot

A Tauc plot[1] is used to determine the optical bandgap, or Tauc gap, in semiconductors.[2] The Tauc gap is often used to characterize practical optical properties of amorphous materials.
Jan Tauc (/taʊts/) showed that the optical absorption spectrum of amorphous germanium resembles the spectrum of the indirect transitions in crystalline germanium (plus a tail due to localized states at lower energies), and proposed an extrapolation to find the optical gap of these crystalline-like states.[3] Typically, a Tauc plot shows the quantity hν (the energy of the light) on the abscissa and the quantity (αhν)1/r on the ordinate, where α is the absorption coefficient of the material. The value of the exponent r denotes the nature of the transition:[4]
- r = 1/2 for direct allowed transitions
- r = 3/2 for direct forbidden transitions.
- r = 2 for indirect allowed transitions
- r = 3 for indirect forbidden transitions
The resulting plot has a distinct linear regime which denotes the onset of absorption. Thus, extrapolating this linear region to the abscissa yields the energy of the optical band gap of the material.
References
- ↑ Tauc, J. (1968). "Optical properties and electronic structure of amorphous Ge and Si". Materials Research Bulletin. 3: 37–46. doi:10.1016/0025-5408(68)90023-8.
- ↑ Stenzel, O. (2005). The Physics of Thin Film Optical Spectra: An Introduction. Springer. p. 214. ISBN 978-3-540-27905-1.
- ↑ Tauc, J.; Grigorovici, R.; Vancu, A. (1966). "Optical Properties and Electronic Structure of Amorphous Germanium". Physica status solidi (b). 15 (2): 627. Bibcode:1966PSSBR..15..627T. doi:10.1002/pssb.19660150224.
- ↑ Davis, E. A.; Mott, N. F. (1970). "Conduction in non-crystalline systems V. Conductivity, optical absorption and photoconductivity in amorphous semiconductors". Philosophical Magazine A. 22 (179): 903–922. doi:10.1080/14786437008221061.