Middle-class squeeze

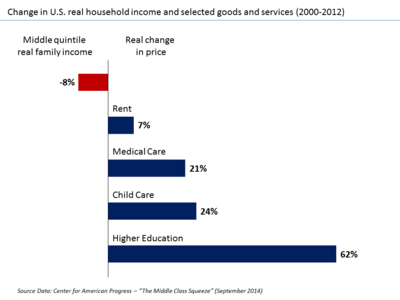
The middle-class squeeze is the situation where increases in wages fail to keep up with inflation for middle-income earners leading to a relative decline in real wages, while at the same time, the phenomenon fails to have a similar effect on the top wage earners. People belonging to the middle class find that inflation in consumer goods and the housing market prevent them from maintaining a middle-class lifestyle, making downward mobility a threat to aspirations of upward mobility. In the United States for example, middle-class income is declining while many goods and services are increasing in price, such as education, housing, child care and healthcare.[1]
Overview
Origin of the term
Former U.S. Speaker of the House Nancy Pelosi used the term in November 2006 to provide context to the domestic agenda of the U.S. Democratic Party.[2][3] The Center for American Progress (CAP) issued a report of the same title in September 2014.[1] However, variations on the theme have been used by politicians attempting to describe the financial challenges facing the middle class and to appeal to the middle class voter for much longer.
Definitions
The term "squeeze" in this instance refers to rising costs of key products and services coupled with stagnant or declining real (inflation adjusted) wages. The Center for American Progress (CAP) defines the term "middle class" as referring to the middle three quintiles in the income distribution, or households earning between the 20th to 80th percentiles in income. CAP reported in 2014: "The reality is that the middle class is being squeezed. As this report will show, for a married couple with two children, the costs of key elements of middle-class security—child care, higher education, health care, housing, and retirement—rose by more than $10,000 in the 12 years from 2000 to 2012, at a time when this family’s income was stagnant." Further, CAP argued that when the middle class is struggling financially, the economy struggles from a shortfall in overall demand, which reduces economic growth (GDP) relative to its potential. The goal of addressing the middle class squeeze includes: "Having more workers in good jobs—who have access to good education; affordable child care, health care, and housing; and the ability to retire with dignity."[1]
Charles Weston[4] summarizes the middle-class squeeze in this way: "Being middle class used to mean having a reliable job with fair pay; access to health care; a safe and stable home; the opportunity to provide a good education for one’s children, including a college education; time off work for vacations and major life events; and the security of looking forward to a dignified retirement. But today this standard of living is increasingly precarious. The existing middle class is squeezed and many of those striving to attain the middle-class standard find it persistently out of reach." [5] This squeeze is also characterised by the fact that, since the early 1980s, when European integration got into full swing, Belgium, France, Germany, Italy and the United Kingdom have experienced strong real wage growth, while real wage growth in the United States has remained sluggish for the most part.[6]
Causes


Causes include factors related to income as well as costs. For the U.S., on the income side, middle class wages have stagnated (in "real" terms, meaning adjusted for inflation) along with worsening income inequality, which has shifted more income to the top of the income distribution and away from the middle class. However, the costs of important goods and services such as healthcare, college tuition, child care, and housing (rent) have increased considerably faster than the rate of inflation.[1]
Income changes
There are many causes of middle-class income stagnation in the United States. One narrative involves the interplay of globalization, supply chain innovation and technology, which has enabled lower-wage workers in developing countries (e.g., China) to compete with higher-wage workers in developed countries (e.g., the U.S.) As a result, middle-class incomes have grown in developing countries like China much faster than in the U.S. measured from 1988 to 2008.[10][11]
Another narrative described by Paul Krugman is that a resurgence of movement conservatism since the 1970s, embodied by Reaganomics in the United States during the 1980s, resulted in a variety of policies that favored owners of capital and natural resources over laborers. Many developed countries did not have an increase in inequality similar to the United States over the 1980-2006 period, even though they were subjected to the same market forces via globalization. This indicates U.S. policy was a major factor in widening inequality.[12]
Either way, the shift is visible when comparing productivity and wages. From 1950 to 1970, improvement in real compensation per hour tracked improvement in productivity. This was part of the implied contract between workers and owners.[13] However, this relationship began to diverge around 1970, when productivity began growing faster than compensation.[14] A declining labor movement, increasing executive pay relative to the average worker, financialization of the economy, and increasing diversion of corporate profits to stock buybacks and dividends are some of the contributing factors to this wage stagnation. In general, for a variety of reasons, the power of lower paid laborers relative to capitalists and landlords has declined.[15]
Recent income statistics
Recent trends indicate wages have stagnated and income inequality has worsened, reducing income available to middle-class families:
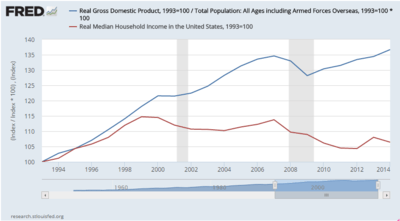
- U.S. median income ("real" or adjusted for inflation) fell from a peak of approximately $57,000 in 1999 to $52,000 in 2013, a decline of about $5,000 or 9%.[16]
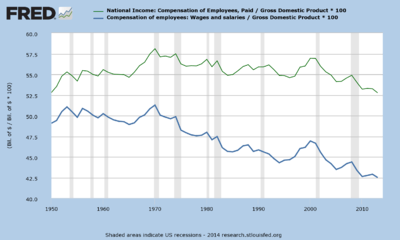
- U.S. employee compensation fell relative to the size of the economy (GDP) from approximately 57% in 2000 to 53% in 2013. Employee wages and salaries, a subset of total compensation, fell from 47% GDP in 2000 to 43% GDP in 2013.[17] This indicates a shift in income from labor to owners of land or capital.
- The U.S. top 1% income group received nearly 23% of the income in 2012, versus 10% from 1950-1970, one measure of increasing income inequality.[18] To put this change into perspective, at 1979 inequality levels, each family in the bottom 80% of the income distribution would today be receiving approximately $7,000 per year more in income on average, or nearly $600 per month.[19]
Historical perspective
In 1995, 60% of American workers were labouring for real wages below previous peaks, while at the median, “real wages for nonsupervisory workers were down 13 percent from peak 1973 levels.”[20] In a study conducted in 2006 by The United States House of Representatives there were some interesting income findings that show the effects of the middle-class squeeze. According to the study, not only is real income decreasing for the middle class, but also the gap between the top wage earners and the middle earners is widening.
Between 2000 and 2005 real median household income in the United States has declined by 2.5%, falling each of the first four years of the Bush Administration, falling by as much as 2.2% annually. Overall real median income has declined since 2000, by $1,273, from $47,599 in 2000, to $46,326 in 2005. According to the survey, working-class families headed by adults younger than 65 have seen even steeper declines. Although they had seen an increase in real median household income from 1995 to 2000 of 9%, since 2000 their income has fallen every year and a total of 5.4%. In actual money terms this correlates to a decrease of $3,000 from $55,284 to $52,287.[3] In 1973, median earnings for men who worked full-time, year-round stood at $51,670 in inflation-adjusted 2012 dollars, while in 2012, the real median earnings of men who worked full-time, year-round stood at $49,398; about 4.4% below the peak median earnings of $51,670 in 1973.[21]
The other way in which income affects the middle class, is through increases in income disparity. Findings on this issue show that the top 1% of wage earners continue to increase the share of income they bring home,[22] while the middle-class wage earner loses purchasing power as his or her wages fail to keep up with inflation. Between 2002 and 2006, the average inflation adjusted income of the top 1% of earners increased by 42%, whereas the bottom 90% only saw an increase of 4.7%.[5]
A 2001 article from “Time Magazine” highlighted the development of the middle-class squeeze. The middle class was defined in that article as those families with incomes between the Census Bureau brackets of $15,000 and $49,999. According to the census, the proportion of American families in that category, after adjustment for inflation, fell from 65.1% in 1970 to 58.2% in 1985. As noted in the article, the heyday of the American middle class, and its high expectations, came in the Fifties and Sixties, when the median U.S. family income (adjusted to 2001 price levels) went up from $14,832 in 1950 to $27,338 in 1970. The rising prosperity was, however, halted by the inflation of the Seventies, which carried prices aloft more rapidly than wages and thus caused real income levels to stagnate for more than a decade. The median in 2000 was only $27,735, barely an improvement from 1970.[23]
As noted by the British historian and journalist Godfrey Hodgson, "On the basis of such evidence I myself have written that “by all statistical measures . . . the United States, in terms of income and wealth, is the most unequal country in the world. While the average income in the United States is still almost the highest in the world . . . the gap between wealth and poverty is higher than anywhere else, and is growing steadily greater”."[24]
As noted by another historian, “Not long ago, unskilled US workers enjoyed what might have been called an “American premium.” They were paid more than labourers with the same skills in other parts of the world simply because, as unskilled Americans, they would work with higher capital-to-labor ratios, better raw materials, and larger numbers of highly skilled fellow workers than their foreign counterparts. As a result, America’s unskilled workers were relatively more productive and thus earned higher wages than similar unskilled workers elsewhere in the world.”[20]
Costs of key goods and services
While overall inflation has generally remained low since 2000,[25] the costs of certain categories of "big ticket" expenses have grown faster than the overall inflation rate, such as healthcare, higher education, rent, and child care. These goods and services are considered essential to a middle-class lifestyle yet are increasingly unaffordable as household income stagnates.[1]
Health care
The Center for American Progress reported in September 2014 that the real (inflation adjusted) cost of healthcare for middle-class families had risen by 21% between 2000 and 2012, versus an 8% decline in real median household income.[1] Insurance and health care is an important factor regarding the middle-class squeeze because increases in these prices can put an added strain on middle income families. This situation is exactly what the House of Representatives survey shows regarding health care prices. In 2000, workers paid an average of $153 per month for health insurance coverage for their families, however, by 2005 these numbers had increased to $226 per month.[3] The effects of the price change in health care can be seen in many ways regarding the middle class. The number of people who are uninsured has also increased since 2000, with 45.7 million Americans now without health insurance, compared to 38.7 million at the start of the millennium. Also, 18% of middle income Americans, making between 40,000 and 59,999 dollars were without health insurance during 2007 and more than 40% of the 2.4 million newly uninsured Americans were middle class in 2003.[26]
The rise in prices also causes a harm to working middle-class Americans because it makes it more costly for employers to cover their employees, as shown by the fact that in 2007 60% of companies offered their workers health insurance down from 69% in 2000. Also the number of Americans who reported skipping treatment due to its cost has increased from 17% to 24% during the same time period.[5]
Education
The Center for American Progress reported in September 2014 that the real (inflation adjusted) cost of higher education for middle-class families had risen by 62% between 2000 and 2012.[1] The benefits of higher education are something that clearly correlates to higher income in later life, with findings showing that the average high school graduate earns $31,286, while the average college graduate makes $57,181, and education is often considered the gateway for upward mobility for the middle class. However, because of increases in college education costs, many middle-class Americans are missing out on a college education because of high prices, or caused them to leave college with massive amounts of debt, not allowing the middle class to enjoy the full benefits of a college education. Studies show that the average cost of a four-year college or university has increased by 76% since 2000, adding to this the middle class faces struggles because of decreasing financial aid. There has been no increase in government Pell grants, while at the same time interest rates for student loans has increased to a 16 year high. These price increases don't just affect middle-class Americans trying to get into college, but they also continue to affect those who attain a college education using the high interest rates of student loans.[3] Two out of three college graduates begin their careers with student loan debt, amounting to $19,300 for the median borrower. These debts have a long-term effect on middle-class Americans, as 25% of Americans who have college debt claim it caused them to delay a medical or dental procedure and 14% report it caused them to delay their marriage.[5]
Rent and property
The Center for American Progress reported in September 2014 that the real (inflation adjusted) cost of rent for middle-class families had risen by 7% between 2000 and 2012.[1] Home-ownership is often seen as an arrival to the middle class, but recent trends are making it more difficult to continue to own a home or purchase a home.[5] Housing prices fell dramatically following their 2006 bubble peak and remain well below this level.[27] Many middle-class homeowners were particularly hard-hit by the crisis, as their homes were highly leveraged (e.g., purchased with a low down payment). The use of leverage magnifies gains (or losses in this case). They owe the full balance of the mortgage yet the value of the home has declined, reducing their net worth significantly.[28]
Energy
Like health care, increases in energy products can put added stress on middle-class families. Gas prices remained in the $3–$4 per gallon range from December 2010-October 2014, high by historical standards.[29] A 2006 Congressional report stated that energy prices had risen over the 2000-2005 interval as well, including gasoline, home heating, and other forms of energy. From 2000-2005 the U.S. has seen a 52% real increase in gasoline prices, a 69% real increase in natural gas prices, a 73% real increase in heating oil costs, a 59% real increase in propane costs, and an 8% real increase in electricity cost. Overall, adjusting for inflation, this results in a cost for American families of $155 more in 2006 then they spent in 2000. Along with these direct cost increase, Americans also face indirect cost associated with higher energy prices, such as higher jet fuel prices, higher gas and diesel prices for commercial airliners, and higher natural gas prices for commercial and industrial users, and assuming these cost are passed on to consumers of these companies, it will cost the average American household $1,150 per year. Taken together these indirect and direct factors cost American middle-class families $2,360 more in 2008 than in 2000.[3]
Other factors

Increases in household debt
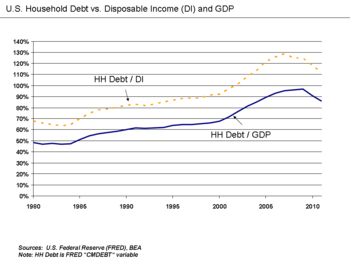
Household debt contains mortgages, credit cards, student and auto loans. The ratio of household debt to GDP rose from approximately 47% GDP in 1980 and peaked at 96% GDP in 2009, driven mainly by mortgage loans, as the U.S. experienced a housing bubble. It then fell to 76% GDP in Q3 2014 due to the effects of the Great Recession as the housing bubble burst and foreclosures increased.[30]
Job security changes
More than 92% of the 1.6 million Americans who filed for bankruptcy in 2003 were middle class.[26] Along with this, manufacturing jobs have decreased by 22% between 1998 and 2008 largely due to outsourcing of American businesses.[5]
Retirement security changes
The squeeze on the middle class is also causing difficulties when it comes to saving money for retirement because of decreased real incomes and increases in consumer prices. In 2007, 1 in 3 American workers said they hadn't saved at all for their retirement and of those who have started saving, more than half claim to have saved less than $25,000. There has also been a shift in employer retirement plans, with a shift from traditional defined benefit pension plans to 401k plans, in which there is no individual guarantee about the amount of retirement income that will be available.[5] The percentage of workers covered by a traditional defined benefit (DB) pension plan declined steadily from 38% in 1980 to 20% in 2008.[31] Employees in unions are more likely to be covered by a defined benefit plan, with 67% of union workers covered by such a plan during 2011 versus 13% of non-union workers.[32]
Solutions
Solutions to the middle class squeeze can involve a variety of strategies, from increasing compensation to reducing costs of certain goods and services or helping the middle-class pay for them. In the U.S., the Center for American Progress (CAP) issued a report in September 2014 called "The Middle Class Squeeze", which identified a variety of causes and solutions.[1]
Increasing compensation
CAP recommended increasing the number of jobs through policies that stimulate economic demand, raising the minimum wage, strengthening the labor movement (including unions), and tax incentives to encourage more redistribution of corporate profits to workers.[1] Several of these solutions are discussed in-depth in articles about U.S. income inequality and unemployment.
Raising the minimum wage
Several studies have indicated that moderate increases in the minimum wage would raise the income of millions with limited effect on employment. The Economist wrote in December 2013: "A minimum wage, providing it is not set too high, could thus boost pay with no ill effects on jobs...America's federal minimum wage, at 38% of median income, is one of the rich world's lowest. Some studies find no harm to employment from federal or state minimum wages, others see a small one, but none finds any serious damage."[33]
The CBO reported in February 2014 that increasing the minimum wage to $10.10 per hour between 2014 and 2016 and indexing it to inflation would reduce employment by an estimated 500,000 jobs, while about 16.5 million workers would have higher pay. A smaller increase to $9.00 per hour (without indexing) would reduce employment by 100,000, while about 7.6 million workers would have higher pay.[34]
Reducing costs
In the U.S., big ticket items for the middle class with costs that are growing faster than the overall rate of compensation include healthcare, childcare, college tuition, and rent. CAP recommended solutions to either directly reduce the costs of these services or help middle-class families pay for them, including education grants, debt forgiveness, more generous family leave, and free (subsidized) pre-school.[1]
Polls and perceptions
According to a Survey on the Middle Class and Public Policy, just 38% of middle-class Americans say they live comfortably, and 77% believe that the country is headed in the wrong direction. Another 2008 report entitled "Inside the Middle Class: Bad Times Hit the Good Life" states that 78% of the middle class say it is more difficult now than it was five years ago. The middle class also responded that 72% believe they are economically less secure than ten years ago and almost twice the number of Americans claimed they were concerned about their personal economic stability. Showing that, overwhelmingly, the American people believe the middle class is being squeezed and are in a worse economic position than they were even 5 years ago.[5]
See also
- Social Mobility
- Economic inequality
- Social status
- Cost of raising a child
- Cost of living
- Superwoman (sociology)
External links
Pew Center-The American Middle Class is Losing Ground-December 2015
References
- 1 2 3 4 5 6 7 8 9 10 11 12 Center for American Progress-The Middle Class Squeeze-September 2014
- ↑ Pelosi-Relieving Middle Class Tops Agenda-November 2006
- 1 2 3 4 5 <Democratic Leader.gov-The Middle-Class Squeeze-September 2006
- ↑ Weston, Charles (2 September 2010). "Charlie Weston: Whole generation swimming against the tide". Irish Independent. Retrieved 25 July 2013.
- 1 2 3 4 5 6 7 8 "The Middle-Class Squeeze 2008: A Drum Major Institute for Public Policy Overview". Drum Major Institute For Public Policy. 2008. Retrieved 2008-11-21.
- ↑ Global democracy: key debates edited by Barry Holden
- ↑ Productivity growth closely matched that of median family income until the late 1970s when median American family income stagnated while productivity continued to climb. Chart comparing productivity growth and real median family income growth in the United States from 1947–2009. Source: EPI Authors' analysis of Current Population Survey Annual Social and Economic Supplement Historical Income Tables, (Table F–5) and Bureau of Labor Statistics Productivity – Major Sector Productivity and Costs Database (2012)
- ↑ Global wage growth stagnates, lags behind pre-crisis rates, ILO, December 5, 2014.
- ↑ NYT-Neil Irwin-You Can't Feed a Family with GDP-September 2014
- ↑ NYT-Paul Krugman-Recent History in One Chart-January 1, 2015
- ↑ Christoph Lakner&Branko Milanovic-World Bank-Global Income Distribution-December 2013
- ↑ Krugman, Paul (2007). The Conscience of a Liberal. W.W. Norton Company, Inc. ISBN 978-0-393-06069-0.
- ↑ Hazlitt, Henry (1979). Economics in One Lesson. Three Rivers Press. ISBN 0-517-54823-2.
- ↑ FRED-Productivity and Real Wages-Retrieved January 2015
- ↑ Slate-Timothy Noah-The Great Divergence-Retrieved January 2015
- ↑ Federal Reserve Economic Database-Real Median Household Income-Retrieved December 2014
- ↑ Federal Reserve Economic Database-Compensation and Wages to GDP-Retrieved December 2014
- ↑ New Yorker-John Cassidy-American Income Inequality in Six Charts-November 2013
- ↑ Lawrence Summers-Harness Market Forces to Share Prosperity-June 24, 2007
- 1 2 Globalization and the Challenges of the New Century: A Reader by Patrick O'Meara (Editor), Howard Mehlinger (Editor), Matthew Krain (Editor)
- ↑ http://cnsnews.com/news/article/terence-p-jeffrey/men-who-work-full-time-earn-less-40-years-ago
- ↑ Leonhardt, David (2007-04-25). "What's Really Squeezing the Middle Class?". NY Times. Retrieved 2008-04-03.
- ↑ "Is the Middle Class Shrinking?". Time. 2001-06-24.
- ↑ http://www.opendemocracy.net/godfrey-hodgson/america-divided-broken-social-contract
- ↑ Federal Reserve Economic Database (FRED)-Inflation-Retrieved December 2014
- 1 2 Schlesinger, Andrea (2004-06-03). "The Middle-Class Squeeze". Retrieved 12 November 2008.
- ↑ Federal Reserve Economic Database (FRED) - S&P Case Shiller 20-City Home Index-Retrieved December 2014
- ↑ Yellen, Janet. "Perspectives on Inequality and Opportunity from the Survey of Consumer Finances". Retrieved October 17, 2014.
- ↑ Federal Reserve Economic Database-Gasoline Prices-Nominal and Real-Retrieved December 2014
- ↑ Federal Reserve Economic Database-Household Debt to GDP-Retrieved December 2014
- ↑ Social Security Administration (March 2009). "The Disappearing Defined Benefit Pension". Social Security Administration. Retrieved May 2013. Check date values in:
|access-date=(help) - ↑ Bureau of Labor Statistics-William Wiatrowski-The Last Private Industry Pension Plans: A Visual Essay-December 2013
- ↑ "The Economist-The Logical Floor-December 2013". The Economist.
- ↑ "CBO-The Effects of a Minimum-Wage Increase on Employment and Family Income-February 18, 2014". Congressional Budget Office.