Richmond Valley Council
| Richmond Valley New South Wales | |||||||||||||
|---|---|---|---|---|---|---|---|---|---|---|---|---|---|
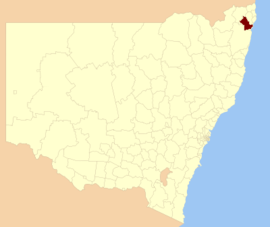
 Location in New South Wales | |||||||||||||
| Coordinates | 28°52′S 153°03′E / 28.867°S 153.050°ECoordinates: 28°52′S 153°03′E / 28.867°S 153.050°E | ||||||||||||
| Population | 23,181 (2015 est)[1] | ||||||||||||
| • Density | 7.5978/km2 (19.678/sq mi) | ||||||||||||
| Established | February 2000 | ||||||||||||
| Area | 3,051 km2 (1,178.0 sq mi)[2] | ||||||||||||
| Mayor | Robert Mustow (independent) | ||||||||||||
| Council seat | Casino | ||||||||||||
| Region | Northern Rivers | ||||||||||||
| State electorate(s) | Clarence | ||||||||||||
| Federal Division(s) | Page | ||||||||||||
 | |||||||||||||
| Website | Richmond Valley | ||||||||||||
| |||||||||||||
Richmond Valley Council is a local government area in the Northern Rivers region of north-eastern New South Wales, Australia. The council services an area of 3,051 square kilometres (1,178 sq mi) and draws its name from the Richmond River, which flows through most of the council area. The area under management is located adjacent to the Bruxner Highway, Pacific Highway, and the North Coast railway line.
It is a rural area for the most part, with most industries involving cattle and crop growing, such as sugar cane, wheat, and pecan plantation.
The Mayor of the Richmond Valley Council is Cr. Robert Mustow, an independent politician.[3]
History
Following a petition of 76 ratepayers, elections were held 22 March 1880 for the Casino Council. Tomki Shire Council merged with Woodburn in 1976 to become the Richmond River Shire Council, which amalgamated with the Municipality of Casino into the Richmond Valley Council in February 2000.[4]
Towns and localities
- Casino
- Backmede
- Boorabee Park
- Bora Ridge
- Bungawalbin
- Busbys Flat
- Camira Creek
- Clearfield
- Clovass
- Codrington
- Coombell
- Coraki
- Dobies Bight
- Dyraaba
- Ellangowan
- Evans Head
- Fairy Hill
- Greenridge
- Hogarth Range
- Irvington
- Leeville
- Myrtle Creek
- Naughtons Gap
- New Italy
- Piora
- Rappville
- Rileys Hill
- Shannon Brook
- Spring Grove
- Stratheden
- Tatham
- Tomki
- Upper Mongogarie
- Whiporie
- Woodburn
- Woodview
- Wyan
- Yorklea
Demographics
At the 2011 census, there were 22,037 people in the Richmond Valley local government area, of these 49.5 per cent were male and 50.5 per cent were female. Aboriginal and Torres Strait Islander people made up 6.6 per cent of the population, which was significantly higher than the national and state averages of 2.5 per cent. The median age of people in the Richmond Valley area was 42 years, which was marginally higher than the national median of 37 years. Children aged 0 – 14 years made up 20.8 per cent of the population and people aged 65 years and over made up 19.6 per cent of the population. Of people in the area aged 15 years and over, 47.6 per cent were married and 13.7 per cent were either divorced or separated.[5]
Population growth in the Richmond Valley area between the 2001 census and the 2006 census was 4.9 per cent; and in the subsequent five years to the 2011 census, the population growth was 3.4 per cent. When compared with total population growth of Australia for the same periods, being 5.78 per cent and 8.32 per cent respectively, population growth in the Richmond Valley local government area was significantly lower than the national average.[6][7] The median weekly income for residents within the Richmond Valley area was marginally lower than the national average.[5]
At the 2011 census, the proportion of residents in the Richmond Valley local government area who stated their ancestry as Australian or Anglo-Saxon exceeded 86 per cent of all residents (national average was 65.2 per cent). In excess of 16 per cent of all residents in the Richmond Valley at the 2011 census nominated no religious affiliation, compared to the national average of 22.3 per cent. Meanwhile, affiliation with Christianity exceeded 66 per cent, which was significantly higher than the national average of 50.2 per cent. As at the census date, compared to the national average, households in the Richmond Valley local government area had a significantly lower than average proportion (3.3 per cent) where two or more languages are spoken (national average was 20.4 per cent); and a significantly higher proportion (93.8 per cent) where English only was spoken at home (national average was 76.8 per cent).[5]
| Selected historical census data for the Richmond Valley local government area | |||||
|---|---|---|---|---|---|
| Census year | 2001[6] | 2006[7] | 2011[5] | ||
| Population | Estimated residents on Census night | 20,326 | 21,313 | 22,037 | |
| LGA rank in terms of size within New South Wales | 67 | ||||
| % of New South Wales population | 0.32% | ||||
| % of Australian population | 0.11% | ||||
| Cultural and language diversity | |||||
| Ancestry, top responses | Australian | 35.6% | |||
| English | 31.4% | ||||
| Irish | 9.6% | ||||
| Scottish | 6.6% | ||||
| German | 3.1% | ||||
| Language, top responses (other than English) | Italian | 0.3% | |||
| Dutch | n/c | n/c | |||
| German | 0.1% | ||||
| Tagalog | 0.1% | ||||
| Filipino | n/c | ||||
| Religious affiliation | |||||
| Religious affiliation, top responses | Catholic | 29.0% | |||
| Anglican | 29.4% | ||||
| No Religion | 9.9% | ||||
| Presbyterian and Reformed | 7.6% | ||||
| Uniting Church | 7.5% | ||||
| Median weekly incomes | |||||
| Personal income | Median weekly personal income | A$342 | A$407 | ||
| % of Australian median income | 73.4% | ||||
| Family income | Median weekly family income | A$826 | A$956 | ||
| % of Australian median income | 70.5% | ||||
| Household income | Median weekly household income | A$651 | A$789 | ||
| % of Australian median income | 63.4% | ||||
Council
Current composition and election method
Richmond Valley Council is composed of seven Councillors, including the Mayor, for a fixed four-year term of office. The Mayor is directly elected while the six other Councillors are elected proportionally as one entire ward. The most recent election was held on 10 September 2016, and the makeup of the Council, including the Mayor, is as follows:[8][9]
| Party | Councillors | |
|---|---|---|
| Independents and Unaligned | 7 | |
| Total | 7 | |
The current Council, elected in 2012, in order of election by ward, is:[9]
| Councillor | Party | Notes | |
|---|---|---|---|
| Robert Mustow | Independent | Mayor[8] | |
| Steve Morrissey | Independent | ||
| Daniel Simpson | Unaligned | ||
| Sandra Duncan-Humphrys | Independent | ||
| Robert Hayes | Independent | ||
| Sam Cornish | Independent | ||
| Jill Lyons | Independent | ||
See also
References
- ↑ "3218.0 – Regional Population Growth, Australia, 2014–15". Australian Bureau of Statistics. Retrieved 29 September 2016.
- ↑ "Richmond Valley Council". Department of Local Government. Retrieved 19 November 2006.
- ↑ http://vtr.elections.nsw.gov.au/richmond-valley-council/mayoral
- ↑ "Richmond Valley Council History". Your Council. Tweed Valley Council. Retrieved 28 May 2016.
- 1 2 3 4 Australian Bureau of Statistics (31 October 2012). "Richmond Valley (A)". 2011 Census QuickStats. Retrieved 10 April 2015.
- 1 2 Australian Bureau of Statistics (9 March 2006). "Richmond Valley (A)". 2001 Census QuickStats. Retrieved 22 May 2016.
- 1 2 Australian Bureau of Statistics (25 October 2007). "Community Profile Series : Richmond Valley (A) (Local Government Area)". 2006 Census of Population and Housing. Retrieved 27 May 2016.
- 1 2 "Richmond Valley Council - Mayoral Election". Local Government Election 2016. New South Wales Electoral Commission. 19 September 2016. Retrieved 13 October 2016.
- 1 2 "Richmod Valley Council: Summary of First Preference and Group Votes for each Candidate". Local Government Election 2016. New South Wales Electoral Commission. 19 September 2016. Retrieved 13 October 2016.