United States presidential election, 1908
| | |||||||||||||||||||||||||||||||||||||||||||
| |||||||||||||||||||||||||||||||||||||||||||
| |||||||||||||||||||||||||||||||||||||||||||

 | |||||||||||||||||||||||||||||||||||||||||||
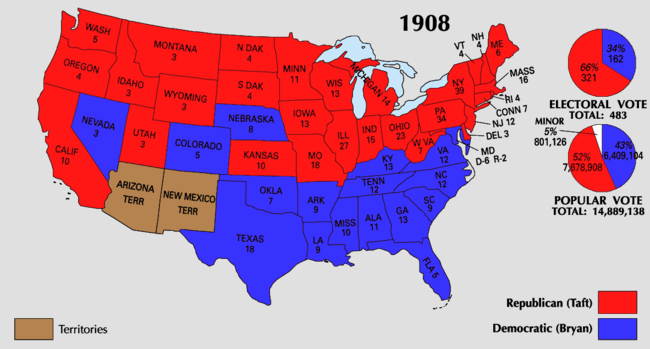
| Presidential election results map. Red denotes those won by Taft/Sherman, blue denotes states won by Bryan/Kern. Numbers indicate the number of electoral votes allotted to each state. | |||||||||||||||||||||||||||||||||||||||||||
| |||||||||||||||||||||||||||||||||||||||||||
The United States presidential election of 1908 was the 31st quadrennial presidential election, held on Tuesday, November 3, 1908. Popular incumbent President Theodore Roosevelt, honoring a promise not to seek a third term, persuaded the Republican Party to nominate William Howard Taft, his close friend and Secretary of War, to become his successor. Having lost the 1904 election badly with a conservative candidate, the Democratic Party turned to two-time nominee William Jennings Bryan, who had been defeated in 1896 and 1900 by Republican William McKinley.
Despite his two previous defeats, Bryan remained extremely popular among the more liberal and populist elements of the Democratic Party. Although he ran a vigorous campaign against the nation's business elite, Bryan suffered the worst loss of his three presidential campaigns.
Nominations
Republican Party nomination
Republican candidates:
- Charles W. Fairbanks, Vice President of the United States
- Joseph B. Foraker, Senator from Ohio
- Philander C. Knox, Senator from Pennsylvania
- Robert M. La Follette, Sr., Senator from Wisconsin
- L. M. Shaw, former Secretary of the Treasury
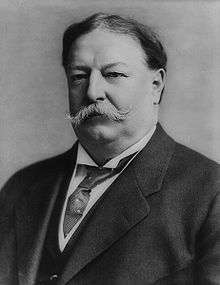
- William Howard Taft, Secretary of War
Candidates gallery

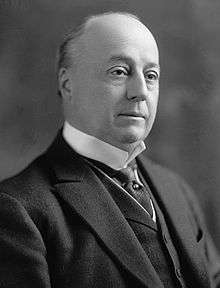

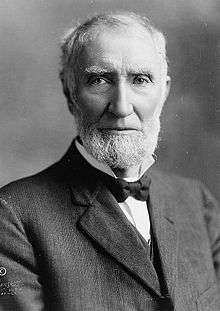


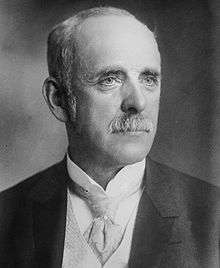
L. M. Shaw
from Iowa

The Republican nomination contest marked the introduction of the presidential preference primary. The idea of the primary to nominate candidates was sponsored by anti-machine politicians such as New York Governor Charles Evans Hughes and Senator Albert B. Cummins. The first state to hold a presidential primary to select delegates to a national convention was Florida in 1904, when Democratic Party voters held a primary among uninstructed candidates for delegate. Early in 1908, the only two Republican contenders running nationwide campaigns for the presidential nomination were Secretary of War William Howard Taft and Governor Joseph B. Foraker, both of Ohio. In the nomination contest, four states held primaries to select national convention delegates. In Ohio, the state Republican Party held a primary on February 11. Candidates pledged to Taft were printed on the ballot in a Taft column, and candidates pledged to Foraker were printed in a column under his name. Taft won a resounding victory in Ohio. The three states holding primaries to select delegates without the preference component were split: California chose a slate of delegates that supported Taft; Wisconsin elected a slate that supported Wisconsin Senator Robert M. La Follette, Sr., and Pennsylvania elected a slate that supported its Senator Philander C. Knox.
The 1908 Republican Convention was held in Chicago between June 16 and 19. William Howard Taft was nominated with 702 votes to 68 for Knox, 67 for Hughes, 58 for Cannon, 40 for Fairbanks, 25 for LaFollette, 16 for Foraker, 3 for President Roosevelt, and one abstention.[2]
| Presidential Ballot | ||
| Candidate | 1st | Unanimous |
| William Howard Taft | 702 | 980 |
|---|---|---|
| Philander C. Knox | 68 | - |
| Charles Evans Hughes | 67 | - |
| Joseph Gurney Cannon | 58 | - |
| Charles W. Fairbanks | 40 | - |
| Robert M. LaFollette, Sr. | 25 | - |
| Joseph B. Foraker | 16 | - |
| Theodore Roosevelt | 3 | - |
| Not Voting | 1 | - |
Representative James S. Sherman from New York received the vice-presidential nomination.
| Vice-Presidential Ballot | ||
| Candidate | 1st | Unanimous |
| James S. Sherman | 816 | 980 |
|---|---|---|
| Franklin Murphy | 77 | - |
| Curtis Guild, Jr. | 75 | - |
| George L. Sheldon | 10 | - |
| Charles W. Fairbanks | 1 | - |
| Not Voting | 1 | - |
Democratic Party nomination
Democratic candidates:
- William Jennings Bryan, former U.S. representative and 1896 and 1900 presidential nominee from Nebraska
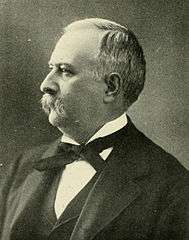
- George Gray, former U.S. senator from Delaware
- John Albert Johnson, Governor of Minnesota
Candidates gallery
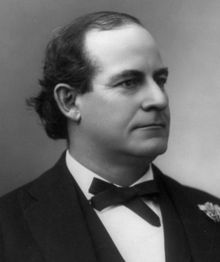
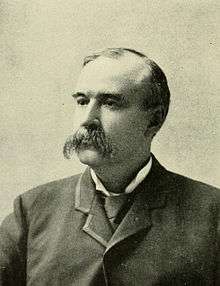
George Gray
from Delaware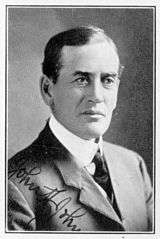
The 1908 Democratic Convention was held in Denver between July 7 and 10. Despite a challenge by Minnesota governor John Albert Johnson, William Jennings Bryan quickly won the overwhelming support of his party.
John W. Kern from Indiana was unanimously declared the candidate for vice-president without a formal ballot after the names of Charles A. Towne, Archibald McNeil, and Clark Howell were withdrawn from consideration.
| Presidential Ballot | ||
| Candidate | 1st | Unanimous |
| William J. Bryan | 888.5 | 1002 |
|---|---|---|
| George Gray | 59.5 | |
| John A. Johnson | 46 | |
| Not Voting | 8 | |
| Vice-Presidential Ballot | ||
| Candidate | 1st | |
| Unanimous | ||
|---|---|---|
| John W. Kern | 1002 | |
Others
Independence Party nomination
Independence candidates:
- John T. Graves, Journalist from New York
- William Randolph Hearst, former U.S. representative and newspaper magnate from New York (Declined)
- Thomas L. Hisgen, Businessman and former Gubernatorial candidate from Massachusetts
- Milford W. Howard, former U.S. representative from Alabama
- Reuben R. Lyon, Lawyer from New York
Candidates gallery
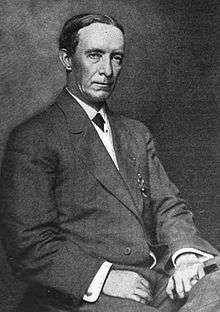 Newspaper editor John Temple Graves from Georgia
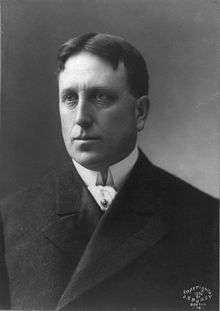
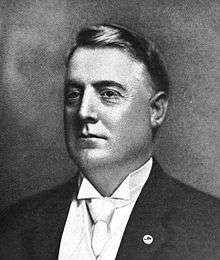 Businessman Thomas L. Hisgen from Massachusetts
Disappointed with his performance in the 1904 Democratic presidential nomination campaign, and disillusioned as to his chances of successfully attaining it in 1908, William Randolph Hearst decided to run instead on the ticket of a third party of his own making. Originally borne from the Municipal Ownership League, a vehicle for Hearst's ultimately unsuccessful bid for the mayoralty of New York in 1905, it was Hearst's intention to fuse it with the remnants of the Populist Party led by Thomas Watson, a former Representative from Georgia who had been its presidential nominee in 1904. However, these intentions were dashed when every candidate that the Independence Party put forth in elections held in New York was elected except Hearst himself, despite an endorsement by the Democratic Party. Devastated, Hearst declared his intention never again to be a candidate.
While Hearst would no longer be the nominee, he fully intended to exercise influence at Independence Party's convention; the platform itself was in large part a statement of his own views. With its candidates nominated, the party's purpose was changed from being a path for Hearst's presidential ambitions to being an instrument of his wrath. Through the influence of his papers and generous financial donations, Hearst hoped that the Independence ticket would draw away votes from William Jennings Bryan and lead to his defeat against Taft, a personal vendetta for Bryan failing to support his own bid for the Presidency in 1904.
| Presidential Ballot | |||
| 1st | 2nd | 3rd | |
|---|---|---|---|
| Thomas L. Hisgen | 396 | 590 | 831 |
| John T. Graves | 213 | 189 | 7 |
| Milford W. Howard | 200 | 109 | 38 |
| Reuben R. Lyon | 71 | 0 | 0 |
| William R. Hearst | 49 | 49 | 2 |
Socialist Party nomination
Socialist candidates:
- Eugene V. Debs, Union leader from Indiana
- Carl D. Thompson, Congregationalist Minister from Wisconsin
- Algie Martin Simons, Editor of the International Socialist Review from Illinois
Candidates gallery

 Congregationalist Minister Carl D. Thompson from Wisconsin
Eugene Debs had originally hoped that Bill Haywood, who had attained a national profile from being put on trial for the murder of Frank Steunenberg, of which he was acquitted, would run for the Socialist nomination for president. At this time however the Socialist Party was fracturing between its radical and more moderate elements, and Debs was deemed the only candidate capable of keeping the party unified. He was overwhelmingly nominated for the presidency on the first ballot, with Benjamin Hanford again named as his running-mate.
General election
Campaign

With the Free Silver issue no longer dominant, Bryan campaigned on a progressive platform attacking "government by privilege." His campaign slogan, "Shall the People Rule?", was featured on numerous posters and campaign memorabilia. However, Taft undercut Bryan's liberal support by accepting some of his reformist ideas, and Roosevelt's progressive policies blurred the distinctions between the parties. Republicans also used the slogan "Vote for Taft now, you can vote for Bryan anytime," a sarcastic reference to Bryan's two failed previous presidential campaigns.
Businessmen continued to support the Republican Party, and Bryan failed to secure the support of labor. As a result, Bryan ended up with the worst of his three defeats in the national popular vote. He lost almost all the northern states to Taft and the popular vote by 8 percentage points.
This would be Bryan's last campaign for the presidency, although he would remain a popular figure within the Democratic Party and in 1912 would play a key role in securing the presidential nomination for Woodrow Wilson. Charles W. Bryan, William's brother, would become the (losing) Democratic nominee for Vice President in 1924.
Results
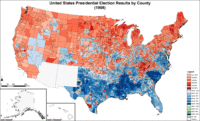
46 states participated, as Oklahoma had joined the Union less than a year before. Bryan won 48 counties in the new state of Oklahoma. The most important increase in number of counties carried by Bryan was in the West South Central section (this was in part due to the vote of newly admitted Oklahoma).[7]
Of the 2,858 counties making returns, Taft won in 1,494 (52.27%) while Bryan carried 1,355 (47.41%). 9 (0.31%) counties recorded more votes cast for "Other(s)" than either of the two-party candidates. Taft had a majority in 1,325 counties while Bryan had a majority in 1,204 counties.
By carrying 1,355 counties, Bryan won more counties than he had in 1900 (1,340), but he did not reach or surpass the number of counties he had won in 1896 (1,559). While Bryan won more counties than McKinley in 1896, Bryan failed to carry more counties than the Republican candidate in 1900 or 1904. Compared with his strength in previous elections, however, Bryan carried 69 counties in 1908 which had not been Democratic in either 1896 or 1900.[8]
Bryan increased the area carried by Democrats in every part of the country except New England and the South. He doubled the number of Democratic counties in Wisconsin and won more counties in Indiana than were carried by plurality vote by the Democrats in any election in the Fourth Party System except 1912. He made decided gains in Missouri and in Nebraska.[7]
Notable were Bryan's victories in Colorado and Nevada, as well as in his home state of Nebraska. But in four Western states (Washington, Oregon, Wyoming, and North Dakota), there was not a Democratic county. This was true likewise of Michigan, Delaware, and each of the New England states.
The total vote increased greatly, more than a million over that of 1904. Each party shared in the increase, but whereas Taft had nearly 50,000 more than Theodore Roosevelt, Bryan had nearly 1,500,000 more votes than Alton Parker had garnered, and more than in either of his previous campaigns.
It was noticeable that the "other" vote was only about 7,000 less than four years earlier. The "other" vote prevailed in 9 counties in the states of Georgia and Texas.
The size of the vote cast for the defeated Bryan in 1908 is clear evidence of perhaps the most striking feature of the American presidential vote. In this third attempt at the presidency, and in an election following one in which the nominee of his party polled only 5,000,000 votes, Bryan had heavy support in every section of the country, and in every state. Moreover, nearly 2/3 of the vote cast for Bryan was from the 15 states of the (Northeastern) Mid-Atlantic, East North Central, and West North Central sections, in which the Democratic candidate carried only one state (Nebraska).
Despite all conclusions as to predominant sentiment in the different sections and its economic, social, and political causes, there was a national vote cast for Bryan, and it was urban as well as rural; it was eastern, western, southern, and northern. Everywhere the Democratic Party was the minority party, and it was not hopeless, nor was it helpless. It was the agency for the expression of the opposition of almost 6,500,000 voters.[8]
| Presidential candidate | Party | Home state | Popular vote | Electoral vote |
Running mate | |||
|---|---|---|---|---|---|---|---|---|
| Count | Pct | Vice-presidential candidate | Home state | Elect. vote | ||||
| William Howard Taft | Republican | Ohio | 7,678,335 | 51.57% | 321 | James S. Sherman | New York | 321 |
| William Jennings Bryan | Democratic | Nebraska | 6,408,979 | 43.04% | 162 | John W. Kern | Indiana | 162 |
| Eugene V. Debs | Socialist | Indiana | 420,852 | 2.83% | 0 | Benjamin Hanford | New York | 0 |
| Eugene W. Chafin | Prohibition | Illinois | 254,087 | 1.71% | 0 | Aaron S. Watkins | Ohio | 0 |
| Thomas L. Hisgen | Independence | Massachusetts | 82,574 | 0.55% | 0 | John Temple Graves | Georgia | 0 |
| Thomas E. Watson | Populist | Georgia | 28,862 | 0.19% | 0 | Samuel Williams | Indiana | 0 |
| August Gillhaus | Socialist Labor | New York | 14,031 | 0.09% | 0 | Donald L. Munro | Virginia | 0 |
| Other | 1,519 | 0.01% | — | Other | — | |||
| Total | 14,889,239 | 100% | 483 | 483 | ||||
| Needed to win | 242 | 242 | ||||||
Source (Popular Vote): Leip, David. "1908 Presidential Election Results". Dave Leip's Atlas of U.S. Presidential Elections. Retrieved September 10, 2012.
Source (Electoral Vote): "Electoral College Box Scores 1789–1996". National Archives and Records Administration. Retrieved July 31, 2005.
Geography of Results
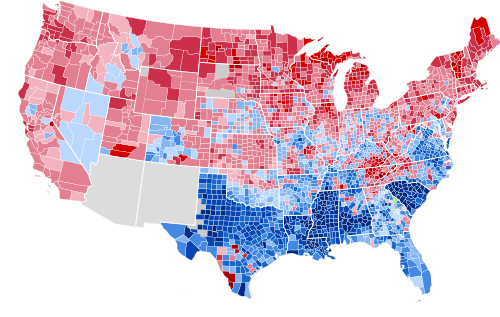 Results by county, shaded according to winning candidate's percentage of the vote
Cartographic Gallery
 Map of presidential election results by county.
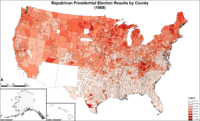 Map of Republican presidential election results by county.
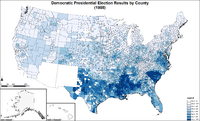 Map of Democratic presidential election results by county.
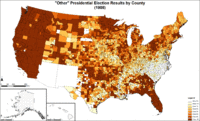 Map of "other" presidential election results by county.
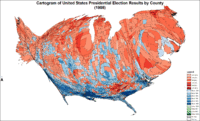 Cartogram of presidential election results by county.
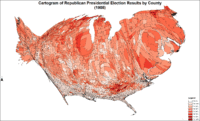 Cartogram of Republican presidential election results by county.
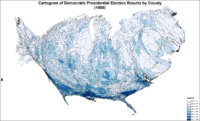 Cartogram of Democratic presidential election results by county.
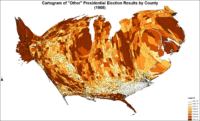 Cartogram of "other" presidential election results by county.
Results by state
| States won by Taft/Sherman |
| States won by Bryan/Kern |
| William Howard Taft Republican |
William Jennings Bryan Democratic |
Eugene V. Debs Socialist |
Eugene Chafin Prohibition |
Thomas Hisgen Independence |
Thomas Watson Populist |
August Gillhaus Socialist Labor |
Margin | State Total | ||||||||||||||||||
|---|---|---|---|---|---|---|---|---|---|---|---|---|---|---|---|---|---|---|---|---|---|---|---|---|---|---|
| State | electoral votes |
# | % | electoral votes |
# | % | electoral votes |
# | % | electoral votes |
# | % | electoral votes |
# | % | electoral votes |
# | % | electoral votes |
# | % | electoral votes |
# | % | # | |
| Alabama | 11 | 25,561 | 24.31 | - | 74,391 | 70.75 | 11 | 1,450 | 1.38 | - | 690 | 0.66 | - | 497 | 0.47 | - | 1,576 | 1.50 | - | - | - | - | -48,830 | -46.44 | 105,152 | AL |
| Arkansas | 9 | 56,624 | 37.30 | - | 87,015 | 57.31 | 9 | 5,842 | 3.85 | - | 1,026 | 0.68 | - | 289 | 0.19 | - | 1,026 | 0.68 | - | - | - | - | -30,391 | -20.02 | 151,822 | AR |
| California | 10 | 214,398 | 55.46 | 10 | 127,492 | 32.98 | - | 28,659 | 7.41 | - | 11,770 | 3.04 | - | 4,278 | 1.11 | - | - | - | - | - | - | - | 86,906 | 22.48 | 386,597 | CA |
| Colorado | 5 | 123,693 | 46.88 | - | 126,644 | 48.00 | 5 | 7,960 | 3.02 | - | 5,559 | 2.11 | - | - | - | - | - | - | - | - | - | - | -2,951 | -1.12 | 263,858 | CO |
| Connecticut | 7 | 112,915 | 59.43 | 7 | 68,255 | 35.92 | - | 5,113 | 2.69 | - | 2,380 | 1.25 | - | 728 | 0.38 | - | - | - | - | 608 | 0.32 | - | 44,660 | 23.50 | 190,003 | CT |
| Delaware | 3 | 25,014 | 52.10 | 3 | 22,055 | 45.94 | - | 239 | 0.50 | - | 670 | 1.40 | - | 29 | 0.06 | - | - | - | - | - | - | - | 2,959 | 6.16 | 48,007 | DE |
| Florida | 5 | 10,654 | 21.58 | - | 31,104 | 63.01 | 5 | 3,747 | 7.59 | - | 1,356 | 2.75 | - | 553 | 1.12 | - | 1,946 | 3.94 | - | - | - | - | -20,450 | -41.43 | 49,360 | FL |
| Georgia | 13 | 41,355 | 31.21 | - | 72,350 | 54.60 | 13 | 584 | 0.44 | - | 1,452 | 1.10 | - | 76 | 0.06 | - | 16,687 | 12.59 | - | - | - | - | -30,995 | -23.39 | 132,504 | GA |
| Idaho | 3 | 52,621 | 54.09 | 3 | 36,162 | 37.17 | - | 6,400 | 6.58 | - | 1,986 | 2.04 | - | 124 | 0.13 | - | - | - | - | - | - | - | 16,459 | 16.92 | 97,293 | ID |
| Illinois | 27 | 629,932 | 54.53 | 27 | 450,810 | 39.02 | - | 34,711 | 3.00 | - | 29,364 | 2.54 | - | 7,724 | 0.67 | - | 633 | 0.05 | - | 1,680 | 0.15 | - | 179,122 | 15.50 | 1,155,254 | IL |
| Indiana | 15 | 348,993 | 48.40 | 15 | 338,262 | 46.91 | - | 13,476 | 1.87 | - | 18,045 | 2.50 | - | 514 | 0.07 | - | 1,193 | 0.17 | - | 643 | 0.09 | - | 10,731 | 1.49 | 721,126 | IN |
| Iowa | 13 | 275,209 | 55.62 | 13 | 200,771 | 40.58 | - | 8,287 | 1.67 | - | 9,837 | 1.99 | - | 404 | 0.08 | - | 261 | 0.05 | - | - | - | - | 74,438 | 15.05 | 494,769 | IA |
| Kansas | 10 | 197,216 | 52.46 | 10 | 161,209 | 42.88 | - | 12,420 | 3.30 | - | 5,033 | 1.34 | - | 68 | 0.02 | - | - | - | - | - | - | - | 36,007 | 9.58 | 375,946 | KS |
| Kentucky | 13 | 235,711 | 48.03 | - | 244,092 | 49.74 | 13 | 4,093 | 0.83 | - | 5,885 | 1.20 | - | 200 | 0.04 | - | 333 | 0.07 | - | 405 | 0.08 | - | -8,381 | -1.71 | 490,719 | KY |
| Louisiana | 9 | 8,958 | 11.93 | - | 63,568 | 84.63 | 9 | 2,514 | 3.35 | - | - | - | - | 77 | 0.10 | - | - | - | - | - | - | - | -54,610 | -72.70 | 75,117 | LA |
| Maine | 6 | 66,987 | 63.00 | 6 | 35,403 | 33.29 | - | 1,758 | 1.65 | - | 1,487 | 1.40 | - | 700 | 0.66 | - | 1 | 0.00 | - | - | - | - | 31,584 | 29.70 | 106,336 | ME |
| Maryland | 8 | 116,513 | 48.85 | 2 | 115,908 | 48.59 | 6 | 2,323 | 0.97 | - | 3,302 | 1.38 | - | 485 | 0.20 | - | - | - | - | - | - | - | 605 | 0.25 | 238,531 | MD |
| Massachusetts | 16 | 265,966 | 58.21 | 16 | 155,543 | 34.04 | - | 10,779 | 2.36 | - | 4,374 | 0.96 | - | 19,237 | 4.21 | - | - | - | - | 1,011 | 0.22 | - | 110,423 | 24.17 | 456,919 | MA |
| Michigan | 14 | 335,580 | 61.93 | 14 | 175,771 | 32.44 | - | 11,586 | 2.14 | - | 16,974 | 3.13 | - | 760 | 0.14 | - | - | - | - | 1,096 | 0.20 | - | 159,809 | 29.49 | 541,830 | MI |
| Minnesota | 11 | 195,843 | 59.11 | 11 | 109,401 | 33.02 | - | 14,527 | 4.38 | - | 11,107 | 3.35 | - | 426 | 0.13 | - | - | - | - | - | - | - | 86,442 | 26.09 | 331,304 | MN |
| Mississippi | 10 | 4,363 | 6.52 | - | 60,287 | 90.11 | 10 | 978 | 1.46 | - | - | - | - | - | - | - | 1,276 | 1.91 | - | - | - | - | -55,924 | -83.59 | 66,904 | MS |
| Missouri | 18 | 347,203 | 48.50 | 18 | 346,574 | 48.41 | - | 15,431 | 2.16 | - | 4,284 | 0.60 | - | 402 | 0.06 | - | 1,165 | 0.16 | - | 868 | 0.12 | - | 629 | 0.09 | 715,927 | MO |
| Montana | 3 | 32,333 | 46.98 | 3 | 29,326 | 42.61 | - | 5,855 | 8.51 | - | 827 | 1.20 | - | 481 | 0.70 | - | - | - | - | - | - | - | 3,007 | 4.37 | 68,822 | MT |
| Nebraska | 8 | 126,997 | 47.60 | - | 131,099 | 49.14 | 8 | 3,524 | 1.32 | - | 5,179 | 1.94 | - | - | - | - | - | - | - | - | - | - | -4,102 | -1.54 | 266,799 | NE |
| Nevada | 3 | 10,775 | 43.93 | - | 11,212 | 45.71 | 3 | 2,103 | 8.57 | - | - | - | - | 436 | 1.78 | - | - | - | - | - | - | - | -437 | -1.78 | 24,526 | NV |
| New Hampshire | 4 | 53,149 | 59.32 | 4 | 33,655 | 37.56 | - | 1,299 | 1.45 | - | 905 | 1.01 | - | 584 | 0.65 | - | - | - | - | - | - | - | 19,494 | 21.76 | 89,600 | NH |
| New Jersey | 12 | 265,298 | 56.80 | 12 | 182,522 | 39.07 | - | 10,249 | 2.19 | - | 4,930 | 1.06 | - | 2,916 | 0.62 | - | - | - | - | 1,196 | 0.26 | - | 82,776 | 17.72 | 467,111 | NJ |
| New York | 39 | 870,070 | 53.11 | 39 | 667,468 | 40.74 | - | 38,451 | 2.35 | - | 22,667 | 1.38 | - | 35,817 | 2.19 | - | - | - | - | 3,877 | 0.24 | - | 202,602 | 12.37 | 1,638,350 | NY |
| North Carolina | 12 | 114,887 | 45.49 | - | 136,928 | 54.22 | 12 | 372 | 0.15 | - | 354 | 0.14 | - | - | - | - | - | - | - | - | - | - | -22,041 | -8.73 | 252,554 | NC |
| North Dakota | 4 | 57,680 | 61.02 | 4 | 32,885 | 34.79 | - | 2,421 | 2.56 | - | 1,496 | 1.58 | - | 43 | 0.05 | - | - | - | - | - | - | - | 24,795 | 26.23 | 94,525 | ND |
| Ohio | 23 | 572,312 | 51.03 | 23 | 502,721 | 44.82 | - | 33,795 | 3.01 | - | 11,402 | 1.02 | - | 439 | 0.04 | - | 162 | 0.01 | - | 721 | 0.06 | - | 69,591 | 6.20 | 1,121,552 | OH |
| Oklahoma | 7 | 110,474 | 43.33 | - | 122,363 | 47.99 | 7 | 21,734 | 8.52 | - | - | - | - | - | - | - | 412 | 0.16 | - | - | - | - | -11,889 | -4.66 | 254,983 | OK |
| Oregon | 4 | 62,530 | 56.39 | 4 | 38,049 | 34.31 | - | 7,339 | 6.62 | - | 2,682 | 2.42 | - | 289 | 0.26 | - | - | - | - | - | - | - | 24,481 | 22.08 | 110,889 | OR |
| Pennsylvania | 34 | 745,779 | 58.84 | 34 | 448,782 | 35.41 | - | 33,914 | 2.68 | - | 36,694 | 2.90 | - | 1,057 | 0.08 | - | - | - | - | 1,224 | 0.10 | - | 296,997 | 23.43 | 1,267,450 | PA |
| Rhode Island | 4 | 43,942 | 60.76 | 4 | 24,706 | 34.16 | - | 1,365 | 1.89 | - | 1,016 | 1.40 | - | 1,105 | 1.53 | - | - | - | - | 183 | 0.25 | - | 19,236 | 26.60 | 72,317 | RI |
| South Carolina | 9 | 3,945 | 5.94 | - | 62,288 | 93.84 | 9 | 100 | 0.15 | - | - | - | - | 46 | 0.07 | - | - | - | - | - | - | - | -58,343 | -87.89 | 66,379 | SC |
| South Dakota | 4 | 67,536 | 58.84 | 4 | 40,266 | 35.08 | - | 2,846 | 2.48 | - | 4,039 | 3.52 | - | 88 | 0.08 | - | - | - | - | - | - | - | 27,270 | 23.76 | 114,775 | SD |
| Tennessee | 12 | 117,977 | 45.87 | - | 135,608 | 52.73 | 12 | 1,870 | 0.73 | - | 301 | 0.12 | - | 332 | 0.13 | - | 1,092 | 0.42 | - | - | - | - | -17,631 | -6.86 | 257,180 | TN |
| Texas | 18 | 65,666 | 22.35 | - | 217,302 | 73.97 | 18 | 7,870 | 2.68 | - | 1,634 | 0.56 | - | 115 | 0.04 | - | 994 | 0.34 | - | 176 | 0.06 | - | -151,636 | -51.62 | 293,757 | TX |
| Utah | 3 | 61,028 | 56.19 | 3 | 42,601 | 39.22 | - | 4,895 | 4.51 | - | - | - | - | 87 | 0.08 | - | - | - | - | - | - | - | 18,427 | 16.97 | 108,613 | UT |
| Vermont | 4 | 39,552 | 75.08 | 4 | 11,496 | 21.82 | - | - | - | - | 799 | 1.52 | - | 804 | 1.53 | - | - | - | - | - | - | - | 28,056 | 53.26 | 52,680 | VT |
| Virginia | 12 | 52,572 | 38.36 | - | 82,946 | 60.52 | 12 | 255 | 0.19 | - | 1,111 | 0.81 | - | 51 | 0.04 | - | 105 | 0.08 | - | 25 | 0.02 | - | -30,374 | -22.16 | 137,065 | VA |
| Washington | 5 | 106,062 | 57.68 | 5 | 58,691 | 31.92 | - | 14,177 | 7.71 | - | 4,700 | 2.56 | - | 249 | 0.14 | - | - | - | - | - | - | - | 47,371 | 25.76 | 183,879 | WA |
| West Virginia | 7 | 137,869 | 53.42 | 7 | 111,418 | 43.17 | - | 3,679 | 1.43 | - | 5,139 | 1.99 | - | - | - | - | - | - | - | - | - | - | 26,451 | 10.25 | 258,105 | WV |
| Wisconsin | 13 | 247,747 | 54.52 | 13 | 166,662 | 36.67 | - | 28,147 | 6.19 | - | 11,565 | 2.54 | - | - | - | - | - | - | - | 318 | 0.07 | - | 81,085 | 17.84 | 454,441 | WI |
| Wyoming | 3 | 20,846 | 55.43 | 3 | 14,918 | 39.67 | - | 1,715 | 4.56 | - | 66 | 0.18 | - | 64 | 0.17 | - | - | - | - | - | - | - | 5,928 | 15.76 | 37,609 | WY |
| TOTALS: | 483 | 7,678,335 | 51.57 | 321 | 6,408,979 | 43.04 | 162 | 420,852 | 2.83 | - | 254,087 | 1.71 | - | 82,574 | 0.55 | - | 28,862 | 0.19 | - | 14,031 | 0.09 | - | 1,269,356 | 8.53 | 14,889,239 | US |
Close states
Margin of victory less than 5% (80 electoral votes):
- Missouri, 0.09%
- Maryland, 0.25%
- Colorado, 1.12%
- Indiana, 1.49%
- Nebraska, 1.54%
- Kentucky, 1.71%
- Nevada, 1.78%
- Montana, 4.37%
- Oklahoma, 4.66%
Margin of victory between 5% and 10% (60 electoral votes):
- Delaware, 6.16%
- Tennessee, 6.86%
- Ohio, 6.20%
- North Carolina, 8.73%
- Kansas, 9.58%
Statistics
Counties with Highest Percent of Vote (Republican)
- Leslie County, Kentucky 92.96%
- Unicoi County, Tennessee 92.77%
- Sevier County, Tennessee 91.44%
- Keweenaw County, Michigan 90.56%
- Johnson County, Tennessee 90.21%
Counties with Highest Percent of Vote (Democratic)
- Hampton County, South Carolina 100.00%
- King County, Texas 100.00%
- Garza County, Texas 100.00%
- Loving County, Texas 100.00%
- Wilcox County, Alabama 99.81%
Counties with Highest Percent of Vote (Other)
- Terry County, Texas 100.00%
- Glascock County, Georgia 69.97%
- McDuffie County, Georgia 64.31%
- Lincoln County, Georgia 61.65%
- Oconee County, Georgia 56.21%
Campaign memorabilia
 Taft-Sherman postcard
 Collier's magazine cover
 Humorous postcard
- John Johnson ribbon
 Taft-Sherman postcard with U.S. Capitol
 Bryan-Kern postcard with U.S. Capitol
See also
- President of the United States
- History of the United States (1865–1918)
- Inauguration of William Howard Taft
References
- ↑ "Voter Turnout in Presidential Elections". The American Presidency Project. UC Santa Barbara.
- ↑ Bain, Richard C.; Parris, Judith H. Convention Decisions and Voting Records. p. 174. ISBN 0-8157-0768-1.
- ↑ "Official report of the proceedings of the fourteenth Republican National Convention, held in Chicago, Illinois, June 16, 17, 18 and 19, 1908". Archive.org. Retrieved 2016-08-18.
- ↑ "Official report of the proceedings of the fourteenth Republican National Convention, held in Chicago, Illinois, June 16, 17, 18 and 19, 1908". Archive.org. Retrieved 2016-08-18.
- ↑ "HISGEN AND GRAVES NEW PARTY TICKET – The Independence Convention Makes Its Choice in Early Morning. BRYAN'S NAME WAS HISSED Small Riot Followed Attempts to Nominate Him and His Sponsor Was Threatened by Delegates. HISGEN AND GRAVES NEW PARTY TICKET". The New York Times. 1908-07-29. Retrieved 2016-08-18.
- ↑ The Presidential Vote, 1896–1932 – Google Books. Stanford University Press. 1934. Retrieved August 12, 2014.
- 1 2 The Presidential Vote, 1896–1932, Edgar E. Robinson, pg. 13
- 1 2 The Presidential Vote, 1896–1932, Edgar E. Robinson, pg. 14
- ↑ "1908 Presidential General Election Data – National". Uselectionatlas.org. Retrieved April 26, 2013.
Further reading
- Daniels, Josephus (July–December 1908). "Mr. Bryan's Third Campaign". Review of Reviews. Review of Reviews. 38: 423–31.
- Korzi, Michael J., “William Howard Taft, the 1908 Election, and the Future of the American Presidency,” Congress and the Presidency, 43 (May-August 2016), 227–54.
External links
| Wikimedia Commons has media related to United States presidential election, 1908. |
- Presidential Election of 1908: A Resource Guide from the Library of Congress
- 1908 popular vote by counties
- The Republican Campaign Textbook 1908
- How close was the 1908 election? — Michael Sheppard, Massachusetts Institute of Technology
- Election of 1908 in Counting the Votes

