Pole figure
A pole figure is a graphical representation of the orientation of objects in space. For example, pole figures in the form of stereographic projections are used to represent the orientation distribution of crystallographic lattice planes in crystallography and texture analysis in materials science.
Definition
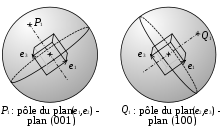
Let us consider an object with a basis attached to it. The orientation of the object in space can be determined by three rotations to transform the reference basis of space to the basis attached to the object; these are the Euler angles.
If we consider a plane of the object, the orientation of the plane can be given by its normal line. If we draw a sphere with the center on the plane, then
- the intersection of the sphere and the plane is a circle, called the "trace" ;
- the intersection of the normal line and the sphere is the pole.
A single pole is not enough to fully determine the orientation of an object: the pole stays the same if we apply a rotation around the normal line. The orientation of the object is fully determined by the use of poles of two planes that are not parallel.
Stereographic projection

The upper sphere is projected on a plane using the stereographic projection.
Let us consider the (x,y) plane of the reference basis; its trace on the sphere is the equator of the sphere. We draw a line joining the South pole with the pole of interest P.
It is possible to choose any projection plane parallel to the equator (except the South pole): the figures will be proportional (property of similar triangles). It is usual to place the projection plane at the North pole.
- Definition
- The pole figure is the stereographic projection of the poles used to represent the orientation of an object in space.
Geometry in the pole figure

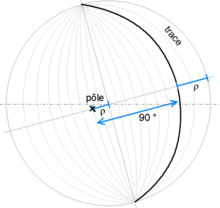
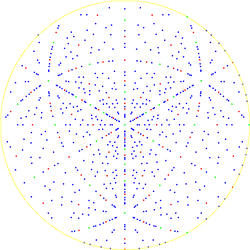
A Wulff net is used to read a pole figure.
The stereographic projection of a trace is an arc. The Wulff net is arcs corresponding to planes which share a common axis in the (x,y) plane.
If the pole and the trace of a plane are represented on the same diagram, then
- we turn the Wulff net so the trace corresponds to an arc of the net;
- the pole is situated on an arc, and the angular distance between this arc and the trace is 90°.
Let us consider an axis Δ, and planes belonging to the zone of this axis, i.e. Δ is in all these planes, the intersection of all the planes is Δ. If we call P the plane that is perpendicular to Δ, then the normals to the planes all belong to P. Thus, the poles of the planes belonging to the same zone are on the trace of the plane P perpendicular to the axis.
Application
Planes of a crystal
The structure of a crystal is often represented by the pole figure of its crystallographic plane.
A plane is chosen as the equator, usually the (001) or (011) plane; its pole is the center of the figure. Then, the poles of the other planes are placed on the figure, with the Miller indices for each pole. The poles that belong to a zone are sometimes linked with the related trace.
Texture
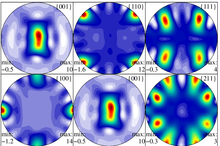
"Texture" in the context of Materials Science means "crystallographic preferred orientation". If a polycrystalline material (i.e. a material composed of many different crystals or grains, like most metals, ceramics or minerals) has "texture" then that means that the crystal axes are not randomly (or, more correctly, uniformly) distributed.
To draw a pole figure, one chooses a particular crystal direction (e.g. the normal to the (100) plane) and then plots that direction, called a pole, for each and every crystal relative to a set of directions in the material. In a rolled metal, for example, the directions in the material are the rolling direction, transverse direction and rolling plane normal.
If a large number of crystals are involved, then it is typical to make a contour plot, rather than plotting individual poles.
The full determination of the texture requires the plot of two pole figures corresponding to planes that are not parallel and that do not have the same diffraction angle (thus different interplanar distances).
Diffraction figure
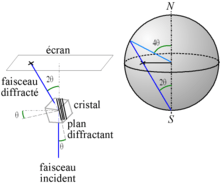
Let us consider the diffraction figure obtained with a single crystal, on a plane that is perpendicular to the beam, e.g. X-ray diffraction with the Laue method, or electron diffraction in a transmission electron microscope. The diffraction figure shows spots.
The position of the spots is determined by the Bragg's law. It gives the orientation of the plane.
If the parameters of the optics are known (especially the distance between the crystal and the photographic film), it is possible to build the stereographic diagram from the diffraction diagram, i.e. to transform the diffraction figure into a pole figure.
References
- ↑ Liss KD, Bartels A, Schreyer A, Clemens H (2003). "High energy X-rays: A tool for advanced bulk investigations in materials science and physics". Textures Microstruct. 35 (3/4): 219–52. doi:10.1080/07303300310001634952.
- Kocks, U. F., C. Tomé, and H.-R. Wenk, Eds. (1998). Texture and Anisotropy, Cambridge University Press, Cambridge, UK, ISBN 0-521-79420-X.
- Val Randle and Olaf Engler (2000), Macrotexture, Microtexture & Orientation Mapping, Gordon & Breach, Amsterdam, Holland, ISBN 90-5699-224-4.
- Adam Morawiec, Orientations and Rotations (2003), Springer, ISBN 3-540-40734-0.
- Piotr Ozga, Pole Figures: Registration and Plot Conventions, http://www.labosoft.com.pl/pf_convention.pdf
External links
- Wulff net with a step of 2° (PDF file, 1p, 272KB)
- http://www.texture.de
- http://mimp.materials.cmu.edu
- MTEX — MATLAB toolbox for Texture Analysis
- Step-by-step animated construction of a Pole Figure from aluMATTER
- StereoPol — plotting & indexing