List of Tanzanian regions by area

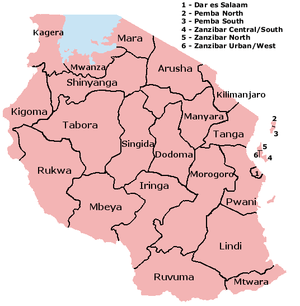
This is a list of the administrative regions of Tanzania in order of their total area, land area, and water area. This data precedes the creation of four new regions in March 2012, bringing the total to 30 regions.
Total area
| Rank | Region | Square kilometres | Square miles |
|---|---|---|---|
| 1 | Tabora | 76,151 | 29,402 |
| 2 | Rukwa | 75,240 | 29,050 |
| 3 | Morogoro | 73,139 | 28,239 |
| 4 | Lindi | 67,000 | 25,869 |
| 5 | Ruvuma | 66,477 | 25,667 |
| 6 | Mbeya | 62,420 | 24,100 |
| 7 | Iringa | 58,936 | 22,755 |
| 8 | Shinyanga | 50,781 | 19,607 |
| 9 | Singida | 49,437 | 19,088 |
| 10 | Manyara | 47,913 | 18,499 |
| 11 | Kigoma | 45,066 | 17,400 |
| 12 | Dodoma | 41,311 | 15,950 |
| 13 | Kagera | 39,627 | 15,300 |
| 14 | Mwanza | 35,187 | 13,586 |
| 15 | Arusha | 34,516 | 13,327 |
| 16 | Pwani | 32,407 | 12,512 |
| 17 | Mara | 31,150 | 11,641 |
| 18 | Tanga | 27,348 | 10,351 |
| 19 | Mtwara | 16,707 | 6,451 |
| 20 | Kilimanjaro | 13,209 | 5,100 |
| 21 | Dar es Salaam | 1,393 | 538 |
| 22 | Zanzibar Central/South | 854 | 330 |
| 23 | Pemba North | 574 | 222 |
| 24 | Zanzibar North | 470 | 181 |
| 25 | Pemba South | 332 | 128 |
| 26 | Zanzibar Urban/West | 230 | 89 |
| 27 | Njombe | 21,347 | 8,057 |
| 28 | Katavi | 45,843 | 17,700 |
| 29 | Simiyu | 23,807.7 |
Land area
| Rank | Region | Square kilometres | Square miles |
|---|---|---|---|
| 1 | Tabora | 79,151 | 29,407 |
| 2 | Morogoro | 70,799 | 27,336 |
| 3 | Rukwa | 68,635 | 26,500 |
| 4 | Lindi | 67,000 | 25,869 |
| 5 | Ruvuma | 63,498 | 24,517 |
| 6 | Mbeya | 60,350 | 23,301 |
| 7 | Iringa | 56,864 | 21,955 |
| 8 | Shinyanga | 50,781 | 19,607 |
| 9 | Singida | 49,342 | 19,051 |
| 10 | Manyara | 46,359 | 17,899 |
| 11 | Dodoma | 41,311 | 15,950 |
| 12 | Kigoma | 37,037 | 14,300 |
| 13 | Arusha | 33,809 | 13,054 |
| 14 | Pwani | 32,407 | 12,512 |
| 15 | Kagera | 28,388 | 10,961 |
| 16 | Tanga | 27,348 | 10,351 |
| 17 | Mwanza | 20,095 | 7,759 |
| 18 | Mara | 19,566 | 7,554 |
| 19 | Mtwara | 16,707 | 6,451 |
| 20 | Kilimanjaro | 13,209 | 5,100 |
| 21 | Dar es Salaam | 1,393 | 538 |
| 22 | Zanzibar Central/South | 854 | 330 |
| 23 | Pemba North | 574 | 222 |
| 24 | Zanzibar North | 470 | 181 |
| 25 | Pemba South | 332 | 128 |
| 26 | Zanzibar Urban/West | 230 | 89 |
Water area
Note: Data is available for only twelve regions. The remaining regions do not have significant lakes or other bodies of water.
| Rank | Region | Square kilometres | Square miles | Percentage Water |
|---|---|---|---|---|
| 1 | Mwanza | 15,092 | 5,827 | 42.9 |
| 2 | Kagera | 11,239 | 4,339 | 28.4 |
| 3 | Mara | 10,584 | 4,087 | 34.0 |
| 4 | Kigoma | 8,029 | 3,100 | 17.8 |
| 5 | Rukwa | 6,605 | 2,550 | 8.8 |
| 6 | Ruvuma | 2,979 | 1,150 | 4.5 |
| 7 | Morogoro | 2,340 | 903 | 3.2 |
| 8 | Iringa | 2,072 | 800 | 3.5 |
| 9 | Mbeya | 2,070 | 799 | 3.3 |
| 10 | Manyara | 1,554 | 600 | 3.2 |
| 11 | Arusha | 707 | 273 | 2.1 |
| 12 | Singida | 95 | 37 | 0.2 |
Sources
Data for the mainland regions are provided by the Statistical Abstract 2011, Tanzania National Bureau of Statistics. Data for the regions of the islands of Zanzibar and Pemba are provided by Regions of Tanzania, Statoids.
This article is issued from Wikipedia - version of the 11/19/2016. The text is available under the Creative Commons Attribution/Share Alike but additional terms may apply for the media files.