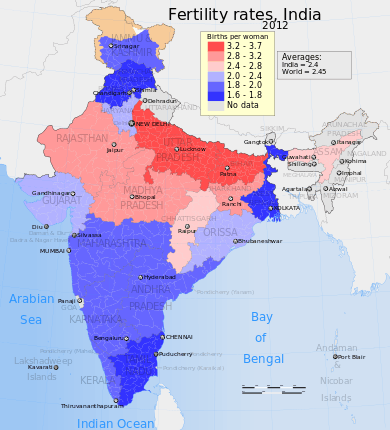
Indian states ranking by fertility rate

This is a list of the states of India ranked in order of number of children born for each woman. Based on this study, the following Indian states, if they continue their current trends of fertility rate or lower them further, will stop contributing to population growth in India in the future: Andhra Pradesh, Goa, Tamil Nadu, Himachal Pradesh, Kerala, Punjab, West Bengal, Maharashtra, Delhi, Jammu and Kashmir, Karnataka, and Sikkim.
All the five southern Indian states – Andhra Pradesh, Telangana,Tamil Nadu, Kerala, and Karnataka – as well as Goa, Punjab, Himachal Pradesh, Jammu and Kashmir, Maharashtra, West Bengal, Sikkim, and Tripura, and the union territories of Delhi, Lakshadweep, Daman and Diu, Andaman and Nicobar, and Chandigarh, registered a low fertility rate below the crucial 2.1. These states accounted for 50.4% of India's population in 2011.
This information was compiled from Chapter 3, ESTIMATES OF FERTILITY INDICATORS from the SRS Report (2013) released by the Census Commission of India. The detailed survey can be viewed at the following website
| Rank | State | Fertility rate 2013 | Fertility rate 2010 | Fertility rate 2007 | Fertility rate 2004 | Fertility rate 2000 | Fertility rate 1995 | Fertility rate 1990 |
|---|---|---|---|---|---|---|---|---|
| Goa | 1.37 | 1.48 | 1.57 | 1.56 | 1.74 | 2.23 | 2.55 | |
| 1 | West Bengal | 1.64 | 1.84 | 2.07 | 2.23 | 2.41 | 3.12 | 3.46 |
| 2 | Punjab | 1.68 | 1.90 | 2.01 | 2.20 | 2.53 | 2.92 | 3.27 |
| 3 | Himachal Pradesh | 1.71 | 1.87 | 1.98 | 2.13 | 2.24 | 2.45 | 2.97 |
| 4 | Tamil Nadu | 1.73 | 1.79 | 1.83 | 1.82 | 2.06 | 2.49 | 2.65 |
| 5 | Delhi | 1.75 | 1.90 | 2.14 | 2.36 | 2.67 | 3.22 | 3.47 |
| 6 | Kerala | 1.77 | 1.84 | 1.74 | 1.71 | 1.85 | 2.37 | 2.84 |
| 7 | Andhra Pradesh | 1.80 | 1.85 | 1.97 | 2.11 | 2.43 | 2.75 | 3.24 |
| 8 | Maharashtra | 1.81 | 1.94 | 2.04 | 2.20 | 2.46 | 2.82 | 3.41 |
| 9 | Karnataka | 1.86 | 2.05 | 2.16 | 2.35 | 2.61 | 2.93 | 3.56 |
| 10 | Jammu and Kashmir | 1.93 | 2.04 | 2.25 | 2.47 | 2.56 | 3.05 | 4.13 |
| 11 | Odisha | 2.08 | 2.37 | 2.45 | 2.66 | 2.74 | 3.09 | 3.77 |
| 12 | Haryana | 2.23 | 2.36 | 2.70 | 3.02 | 3.23 | 3.67 | 3.92 |
| 13 | Gujarat | 2.31 | 2.57 | 2.62 | 2.85 | 3.18 | 3.45 | 3.67 |
| 14 | Assam | 2.34 | 2.54 | 2.77 | 2.98 | 3.46 | 4.01 | 4.54 |
| - | INDIA | 2.34 | 2.53 | 2.76 | 2.94 | 3.14 | 3.55 | 3.81 |
| 15 | Chhattisgarh | 2.63 | 2.81 | 3.03 | 3.36 | 3.65 | 3.83 | 4.52 |
| 16 | Jharkhand | 2.72 | 3.03 | 3.28 | 3.57 | 3.81 | 4.64 | 5.03 |
| 17 | Rajasthan | 2.80 | 3.14 | 3.44 | 3.79 | 4.01 | 4.25 | 4.36 |
| 18 | Madhya Pradesh | 2.88 | 3.27 | 3.42 | 3.71 | 3.93 | 4.05 | 4.18 |
| 19 | Uttar Pradesh | 3.12 | 3.55 | 4.07 | 4.46 | 5.04 | 5.42 | 5.61 |
| 20 | Bihar | 3.41 | 3.74 | 4.09 | 4.37 | 4.75 | 5.17 | 5.48 |
Country comparisons use data from the Population Reference Bureau.
Visualisation
Google Chart TFR vs Area vs Population