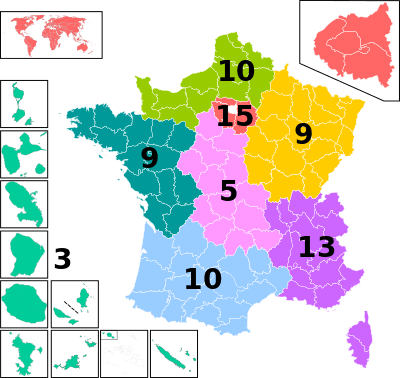
European Parliament constituencies in France

European Parliament constituencies in France (borders effective since 2004, the number of seats per constituency are effective since 2014; French citizens living abroad were added to the Île-de-France constituency in 2014).
This is a table of European Parliament constituencies in France, listing the number of Members of the European Parliament each elected at each European Parliamentary election.
The names and borders of the constituencies have varied over time, but they have used the party-list proportional representation with the highest average method since their creation.
| Election | Constituencies | Total seats | |||||||
|---|---|---|---|---|---|---|---|---|---|
| France | |||||||||
| (1973) | (MEPs nominated ) | ||||||||
| 1979 | 81 | 81 | |||||||
| 1984 | 81 | 81 | |||||||
| 1989 | 81 | 81 | |||||||
| 1994 | 87 | 87 | |||||||
| 1999 | 87 | 87 | |||||||
| North-West | West | East | South-West | South-East | Massif central–Centre | Île-de-France | Overseas | ||
| 2004 | 12 | 10 | 10 | 10 | 13 | 6 | 14 | 3 | 78 |
| 2009 | 10 | 9 | 9 | 10 | 13 | 5 | 13 | 3 | 72[Note 1] |
| 2014 | 10 | 9 | 9 | 10 | 13 | 5 | 15[Note 2] | 3 | 74 |
See also
Notes and references
- ↑ Following the ratification of the Treaty of Lisbon by France on 14 February 2008, and entering into application on 1 December 2009 (after the last instruments were deposited by Italy, too late for the 2009 European elections), 2 additional seats were assigned to France and were finally appointed by the French Parliament in 2011.
- ↑ The 2 additional seats for the elections in 2014, previously appointed by the French Parliament, were finally assigned to the Île-de-France constituency as it was enlarged in 2014 to include also the votes for French citizens living abroad (and not registered for the European elections in another member state of the European Union).
| ||||||||||||||||||||||||||||||||||||||||
This article is issued from Wikipedia - version of the 2/10/2016. The text is available under the Creative Commons Attribution/Share Alike but additional terms may apply for the media files.