Distance matrix
In mathematics, computer science and especially graph theory, a distance matrix is a matrix (two-dimensional array) containing the distances, taken pairwise, between the elements of a set. Depending upon the application involved, the distance being used to define this matrix may or may not be a metric. If there are N elements, this matrix will have size N×N. In graph-theoretic applications the elements are more often referred to as points, nodes or vertices.
Metric distance
When distance is defined as a metric, as for example in the Euclidean distance matrix, the distance matrix satisfies properties directly related to the defining properties of a metric. That is, if M = (xij) with 1 ≤ i, j ≤ N is a distance matrix for a metric distance, then
- the entries on the main diagonal are all zero (that is, the matrix is a hollow matrix), i.e. xii = 0 for all 1 ≤ i ≤ N,
- all the off-diagonal entries are positive (xij > 0 if i ≠ j),
- the matrix is a symmetric matrix (xij = xji), and
- for any i and j, xij ≤ xik + xkj for all k (the triangle inequality).
Another common example of a distance matrix arises in coding theory when in a block code the elements are strings of fixed length over an alphabet and the distance between them is given by the Hamming distance metric. The smallest non-zero entry in the distance matrix measures the error correcting and error detecting capability of the code.
Non-metric distance
In a network, a directed graph with weights assigned to the arcs, the distance between two nodes of the network can be defined as the minimum of the sums of the weights on the shortest paths joining the two nodes.[1] This distance function, while well defined, is not a metric. There need be no restrictions on the weights other than the need to be able to combine and compare them, so negative weights are used in some applications. Since paths are directed, symmetry can not be guaranteed, and if cycles exist the distance matrix may not be hollow.
An algebraic formulation of the above can be obtained by using the min-plus algebra. Matrix multiplication in this system is defined as follows: Given two matrices and , their distance product is defined as an matrix such that . Note that the off-diagonal elements that are not connected directly will need to be set to infinity or a suitable large value for the min-plus operations to work correctly. A zero in these locations will be incorrectly interpreted as an edge with no distance, cost, etc.
If is an matrix containing the edge weights of a graph, then (using this distance product) gives the distances between vertices using paths of length at most edges, and is the distance matrix of the graph.
An arbitrary graph G on n vertices can be modeled as a weighted complete graph on n vertices by assigning a weight of one to each edge of the complete graph that corresponds to an edge of G and zero to all other edges. W for this complete graph is the adjacency matrix of G. The distance matrix of G can be computed from W as above, however, Wn calculated by the usual matrix multiplication only encodes the number of paths between any two vertices of length at most n.
Applications
Hierarchical Clustering
A distance matrix is necessary for hierarchical clustering.
Phylogenetic Analysis
Distance matrices are used in phylogenetic analysis.
Other uses
In bioinformatics, distance matrices are used to represent protein structures in a coordinate-independent manner, as well as the pairwise distances between two sequences in sequence space. They are used in structural and sequential alignment, and for the determination of protein structures from NMR or X-ray crystallography.
Sometimes it is more convenient to express data as a similarity matrix.
Examples
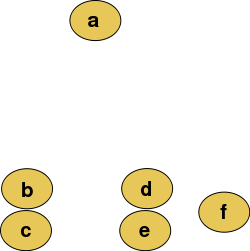
For example, suppose these data are to be analyzed, where pixel euclidean distance is the distance metric.

The distance matrix would be:
| a | b | c | d | e | f | |
|---|---|---|---|---|---|---|
| a | 0 | 184 | 222 | 177 | 216 | 231 |
| b | 184 | 0 | 45 | 123 | 128 | 200 |
| c | 222 | 45 | 0 | 129 | 121 | 203 |
| d | 177 | 123 | 129 | 0 | 46 | 83 |
| e | 216 | 128 | 121 | 46 | 0 | 83 |
| f | 231 | 200 | 203 | 83 | 83 | 0 |
These data can then be viewed in graphic form as a heat map. In this image, black denotes a distance of 0 and white is maximal distance.
See also
References
- ↑ Frank Harary, Robert Z. Norman and Dorwin Cartwright(1965) Structural Models: An Introduction to the Theory of Directed Graphs, pages 134–8, John Wiley & Sons MR 0184874