Demographics of Canberra
Canberra is the largest inland city of Australia, and is amongst the most populated in the Oceania. It is the capital city of Australia. At the 2011 census it had 355,596 residents.[1] This only contains 1.6% of the total Australian population. The population density for Canberra is 443.5 people per sq kilometre.
More than a quarter of Canberra's population were born overseas. 28.6% of the population were born elsewhere, a large majority which come from North-West Europe, Southern and Eastern Europe and South-East Asia.[1] The 2010 unemployment rate is estimated around 3.5%
The median age for Canberra was 34 years, and households had an average of 2.6 members.[1]
The estimated population for Canberra as of 2011 was 355,596, constituting 175,896 males and 179,700 females.[1]
History
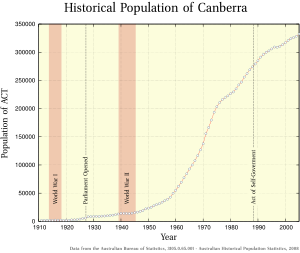
The first few decades after the establishment of Canberra growth was relatively slow due to low funds after World War I. The population was nearly 2000 at the time. Until the end of World War II development was completely put on hold due to the Great Depression.
Office development accelerated rapidly in the 1960s in Civic. From 1960 - 1971, the population tripled from 50,000 inhabitants to 146,000 and climbing to 203,000 in 1976. The Australian economy went into recession in 1975, and a year later the construction industries in Canberra collapsed.
In modern times, the growth completely slowed in 1996 - 2001. However, the city experiences over 1 percent growth annually. The population in 2011 is around 358,222.[2]
| Historical population | ||
|---|---|---|
| Year | Pop. | ±% |
| 1911 | 1,700 | — |
| 1930 | 9,000 | +429.4% |
| 1945 | 13,000 | +44.4% |
| 1957 | 39,000 | +200.0% |
| 1960 | 50,000 | +28.2% |
| 1966 | 96,000 | +92.0% |
| 1971 | 146,000 | +52.1% |
| 1976 | 203,000 | +39.0% |
| 1983 | 235,000 | +15.8% |
| 1988 | 270,000 | +14.9% |
| 2000 | 311,000 | +15.2% |
| 2011 | 358,000 | +15.1% |
Populations by district
Gungahlin's part in growth constitutes nearly all of the growth from 1996-2001.[3]
| Population of Canberra districts | 1991[4] | 1996 | 2001 | 2006 | 2011 |
|---|---|---|---|---|---|
| North Canberra | 40,249 | 38,818 | 38,585 | 43,757 | 48,030[5] |
| South Canberra | 22,371 | 22,730 | 23,324 | 24,581 | 24,154[6] |
| Belconnen | 89,519 | 85,659 | 81,701 | 87,246 | 92,444[7] |
| Woden Valley | 33,921 | 33,043 | 32,494 | 31,992 | 32,958[8] |
| Weston Creek | 27,268 | 24,879 | 23,662 | 22,886 | 22,746[9] |
| Tuggeranong | 74,412 | 90,104 | 90,875 | 89,666 | 86,900[10] |
| Gungahlin | 455 | 12,684 | 24,398 | 32,550 | 47,303 [11] |
| Total Canberra | 288,195 | 307,917 | 319,317 | 334,225 | 355,596[1] |
Religion
In the 2011 census, the most common responses for religion were no religion (28.9%) Catholic (26.1%), Anglican (14.7%), United Church (3.3%) and Buddhism (2.6%).[1]
Demographic Statistics
The following statistics are from the Australian Bureau of Statistics.[12][13]

Median age
- 34.0 years of age
Age structure
- 0-14 years: 18.4% (66,000)
- 15–64 years: 71.2%(255,300)
- 65 years and over: 10.4%(37,200)
Population growth rate
- 1.6%
Birth rate
- 13.5 births/1,000 population (2010 est.)
Death rate
- 4.5 deaths/1,000 population (July 2010 est.)
Sex ratios
- There were 99.0 males for every 100 females in Canberra as of 2010.
- Civic had the highest sex ratio (137.2 males for every 100 females.)
- Deakin had the lowest sex ratio (80.6 males for every 100 females.)
Total fertility rate
- 1.6 children born/woman (2001 est.)[14]
Unemployment rate
4.5%
References
- 1 2 3 4 5 6 Template:Census 1812 AUS
- ↑ History of Canberra.
- ↑ Canberra at the 2006 Census. ACT Planning & Land Authority. Retrieved December 2007.
- ↑ McLennan, W. (May 1998). "1996 Census of Population and Housing" (PDF). Australian Bureau of Statistics. Department of the Environment. pp. 98–100. ISBN 0 642 25690 X. Retrieved 7 April 2015.
- ↑ Australian Bureau of Statistics (31 October 2012). "North Canberra (Statistical Subdivision)". 2011 Census QuickStats. Retrieved 29 January 2015.
- ↑ Australian Bureau of Statistics (31 October 2012). "South Canberra (Statistical Subdivision)". 2011 Census QuickStats. Retrieved 29 January 2015.
- ↑ Australian Bureau of Statistics (31 October 2012). "Belconnen (SA3)". 2011 Census QuickStats. Retrieved 29 January 2015.
- ↑ Australian Bureau of Statistics (31 October 2012). "Woden (SA3)". 2011 Census QuickStats. Retrieved 29 January 2015.
- ↑ Australian Bureau of Statistics (31 October 2012). "Weston Creek (SA3)". 2011 Census QuickStats. Retrieved 29 January 2015.
- ↑ Australian Bureau of Statistics (31 October 2012). "Tuggeranong (SA3)". 2011 Census QuickStats. Retrieved 29 January 2015.
- ↑ Australian Bureau of Statistics (31 October 2012). "Gungahlin (SA3)". 2011 Census QuickStats. Retrieved 29 octembuary 2015. Check date values in:
|access-date=(help) - ↑ Population in 2010. Retrieved 4 August 2011.
- ↑ Canberra at the 2011 census. Retrieved 21 June 2012.
- ↑ Fertility rate of Australia in 2001 Australian Bureau of Statistics. 31 October 2001. Retrieved 31 October 2001.