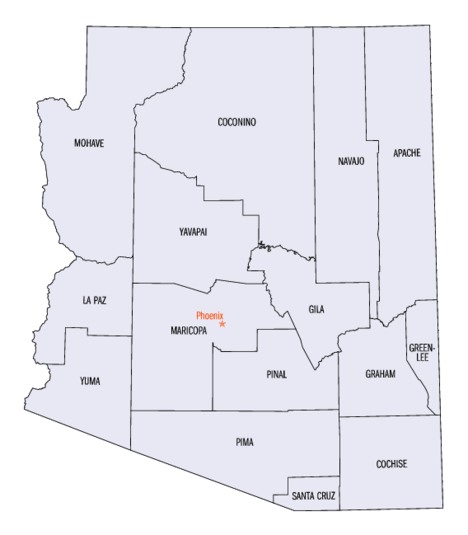
Arizona census statistical areas
The statistical areas of the United States of America comprise the metropolitan statistical areas (MSAs),[1] the micropolitan statistical areas (μSAs),[2] and the combined statistical areas (CSAs)[3] currently defined by the United States Office of Management and Budget (OMB).
Most recently on December 1, 2009, the Office of Management and Budget defined 1067 statistical areas for the United States,[4] including six metropolitan statistical areas and four micropolitan statistical areas in the State of Arizona. The table below shows the recent population of these statistical areas and the 15 counties of Arizona.

Table
The table below describes the 11 United States statistical areas and 15 counties of the State of Arizona with the following information:
- The core based statistical area (CBSA)[5] as designated by the OMB.[4]
- The CBSA population as of the 2010 Census [6]
- The county name.
- The county population as of the 2010 Census, as estimated by the United States Census Bureau.
See also
- State of Arizona
- Demographics of the United States
References
- ↑ The United States Office of Management and Budget (OMB) defines a metropolitan statistical area (MSA) as a core based statistical area having at least one urbanized area of 50,000 or more population, plus adjacent territory that has a high degree of social and economic integration with the core as measured by commuting ties.
- ↑ The United States Office of Management and Budget (OMB) defines a micropolitan statistical area (μSA) as a core based statistical area having at least one urban cluster of at least 10,000 but less than 50,000 population, plus adjacent territory that has a high degree of social and economic integration with the core as measured by commuting ties.
- ↑ The United States Office of Management and Budget (OMB) defines a combined statistical area (CSA) as an aggregate of adjacent core based statistical areas that are linked by commuting ties.
- 1 2 "OMB Bulletin No. 10-02: Update of Statistical Area Definitions and Guidance on Their Uses" (PDF). United States Office of Management and Budget. December 1, 2009. Retrieved August 8, 2012.
- ↑ The United States Office of Management and Budget (OMB) defines a core based statistical area as one or more adjacent counties or county-equivalents having at least one urban cluster of at least 10,000 population, plus adjacent territory that has a high degree of social and economic integration with the core as measured by commuting ties. The core based statistical areas comprise the metropolitan statistical areas and the micropolitan statistical areas.
- ↑ "Population Change for Metropolitan and Micropolitan Statistical Areas in the United States and Puerto Rico (February 2013 Delineations): 2000 to 2010" (XLS). United States Census, 2010. United States Census Bureau, Population Division. March 2013. Retrieved March 14, 2013.
